0

as suggested in the following thread:
Period detection of a generic time series
I'm testing the function findfrequency() to automatize the estimation of the period in timeseries i do not know anything about beforehand. In one of my tests i ended up in a time series with the following values:

    126 784 894 906 938 881 908 867 53 875 878 894 54 852 940 860 56 874 893 898 879 936 876 924 141 753 890 891 910 885 889 295 609 915 895 886 904 902 898 482 414 904 896 904 896 904 932 452 427 888 901 896 905 900 899 666 230 1800 1839 1799 1762 1823 33732 6721 6644 7179 6811 1440 5156 6562 46010 6930 6002 6122 6690 6238 6005 48725 43277 5481 37639 18 5816 6148 5377 5942 5510 1152 35 5909 6783 544 908 877 904 901 899 896 312 630 867 895 896 909 33300 123 6666 7168 6456 6353 2048 3683 6015 4727 878 915 20 469 433 877 887 893 906 894 906 410 484 47 896 33228 143 6052 6365 6160 5709 6962 5638 6966 5997 

whose graph looks like this: Timeseries graph

and by calling findfrequency() i get 111 as a period. However the points are in total 139, and therefore how can i have a period which is greater than half of the amount of datapoints of the timeseries?

From an eye evaluation it doesn't look like this series has any kind of periodicity i would have expected a 1 as result, am i missing something?

Also the acf function of the series doesn't show any significant maximum in the wave which should suggest no strong periodicity
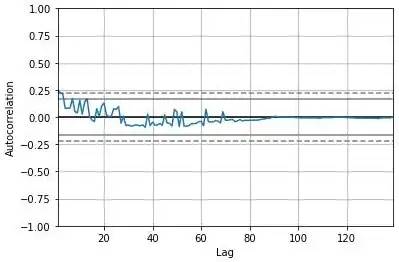
ACF

nonoDa
  • 111
  • 2
  • Is it possible to write the function find frequency you use explicitly. In the function you show there is a empirical threshold, did you change the threshold value? Also its quite possible you need to preprocess your time series (but again this is hard to tell with so few information on what you exactly did.). – PauZen Jan 20 '21 at 12:30
  • @PauZen I did not change the treshold i just ran findfrequency(x) as a "blackbox", maybe i should try with different values for the given parameter although it kinda fails the point of using the method to binary detect if there's a periodicity or not as apparently i suppose you agree with me that **111** it's not a good estimate. Also i did nothing else on the timeseries other than what i wrote on the question. For the preprocessing part could you elaborate a little more? thanks in advance – nonoDa Jan 20 '21 at 13:53
  • from further inspection of the underlying code it looks like the value that comes out of `max(spec$spec)` is huge 312370325, which is obviously greater than the treshold value (10). Therefore the alghoritms computes `period – nonoDa Jan 20 '21 at 14:00
  • Another update, by not removing trend (which is the only thing i'm sure will not be present in my timeseries) and therefore removing this line `x – nonoDa Jan 20 '21 at 14:26
  • Your graph deceives you, because you have missing data but you obscure those by connecting successive values across those gaps. (It is a serious mistake to analyze the data as a sequence of numbers, stripped of their time stamps.) A more faithful visualization would show a clear annual periodicity (with one outlier in late 2011). The ACF is meaningless unless you have filled in the missing values with NaNs or imputed values, which is why it looks so strange. – whuber Jan 20 '21 at 15:44
  • @whuber jan X is month-day, anyways my original data is basically a binary timeseries, with 1 if something happend on a given day and 0 if it didn't. What you see in this graph is basically the difference between contiguous timestamp (in unixtime). Therefore in the graph provided in the post i have the differences on the Y axis and the timestamps on the X axis. I thought that this would be a good way to visualize the series as opposed to a binary 0/1 which would be just rectangles. Am i making a mistake? how should i approach this? thanks again – nonoDa Jan 20 '21 at 15:54
  • The ACF only makes sense and is useful when the series of observations corresponds to equally spaced times, with no gaps. According to your graph, that is not the case. I am reluctant to recommend any approaches until questions about what your data really are can be cleared up. – whuber Jan 20 '21 at 16:04
  • I'll try to make it clearer , my data are binary observations of logins in machines which are observed all the time, at a given moment i could have an access and therefore a timestamp with "access". i'm taking a week of observations and therefore i have a vector of timestamps which refers to accesses performed on the machine. What i did to graph it was computing the difference between contigous accesses and it's what is displayed in the image attached to the post. I'm thinking maybe i should just give the timestamp (in unixtime) as the series to compute for findfrequency() – nonoDa Jan 20 '21 at 16:10
  • You do not have a time series and `findfrequency()`, although it can be forced to give you a number, is inappropriate and wrong. That's why you are going astray and why your question is so misleading. – whuber Jan 21 '21 at 15:19
  • Let us [continue this discussion in chat](https://chat.stackexchange.com/rooms/118744/discussion-between-nonoda-and-whuber). – nonoDa Jan 21 '21 at 15:57

0 Answers0