4

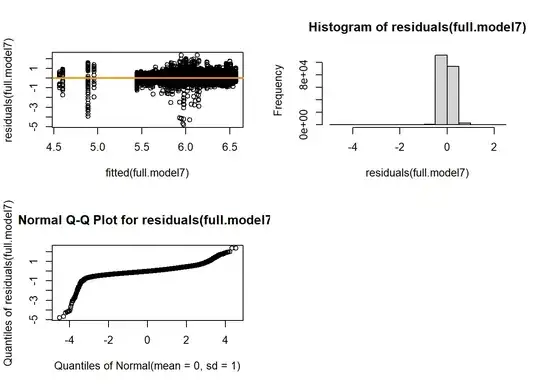
I am running a mixed effects model and the residuals/qq plot look terrible. I have also ran a glmer model to check if the results change when using a better model and they lead very much to the same conclusions. I have also tried using the Box Cox transformation, but the residuals look exactly the same. Would it be ok to use this model as it is more interpretable than glmer and shows similar results? Or should I definitely use a non-linear model?

The model:

full.model7 <- lmer(logRT ~ P*B*S*G + (1+S+P+B|Participant),data= Data, REML=FALSE, control=lmerControl(optimizer="bobyqa",optCtrl=list(maxfun=2e5)))

The plots: enter image description here

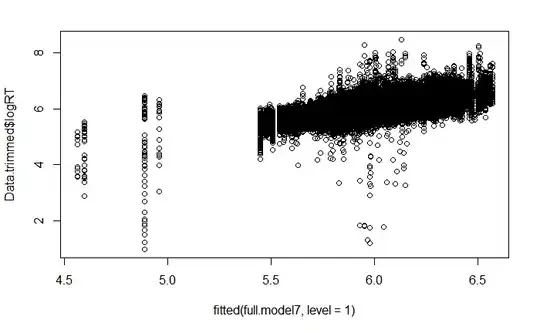
As solicited, here is the plot fitted versus observed:

enter image description here

I also ran the model using a Box Cox transformation in the MASS package but did not improve the residuals:
enter image description here

CatM
  • 442
  • 3
  • 15
  • What is your goal of performing regression? Is it to rigourously test a certain hypothesis or something else? (And another note, it seems like you fit the logarithm of A, why is that?) – Sextus Empiricus Nov 10 '20 at 08:11
  • In [this answer](https://stats.stackexchange.com/a/353590/164061) you see an example how the residuals can have a coarse structure, while it is perfectly fine. Residuals are not monovariate normal distributed with mixed models, which is due to the random effect and the clustering in groups. This might be the case with your results as well (the cluster of points with a residual around -5). You also have some skewness, a few very negative values versus many little positive values. That might not be problematic. Your model will still fit well, only the interpretation of p-values might be tricky. – Sextus Empiricus Nov 10 '20 at 08:16
  • What does the variable A describe? – Roland Nov 10 '20 at 08:45
  • @Roland I just changed A to RT as it is response times. I am using the regression for hypothesis testing. – CatM Nov 10 '20 at 13:21
  • https://stats.stackexchange.com/questions/254361/modeling-reaction-time-with-glmer – Roland Nov 10 '20 at 13:28
  • Could you plot fitted versus observed. Could you provide summary statistics and describe the model (what the variables are, etc.). – Sextus Empiricus Nov 10 '20 at 13:37
  • @ Sextus Empiricus Given that I need to use p-values, I think I may just need to go with glmer models. – CatM Nov 19 '20 at 23:31
  • @SextusEmpiricus Just added the plot you asked for. All predictors are categorical P is two level, B is 5 level (4 contrasts), S is two level and G is two level as well. – CatM Nov 20 '20 at 01:01

0 Answers0