I'd like to simulate the chi-square test without using the chi-square distribution on the following 2×2 table.
I made "chiq_2by2" function using the R (See #main function in the Box1,below). The "chiq_2by2" function itself seems to calculate the correct chi-square values from the given TA, TB, FA, and FB.
I tried to obtain the distributions of the chi-squared values by driving TA and TB with two different methods (See Box1, below):
- The method using random value (See "#The method using random value" in the Box1) and,
- The method based on round robin (See "The method based on round robin" in the Box1) .
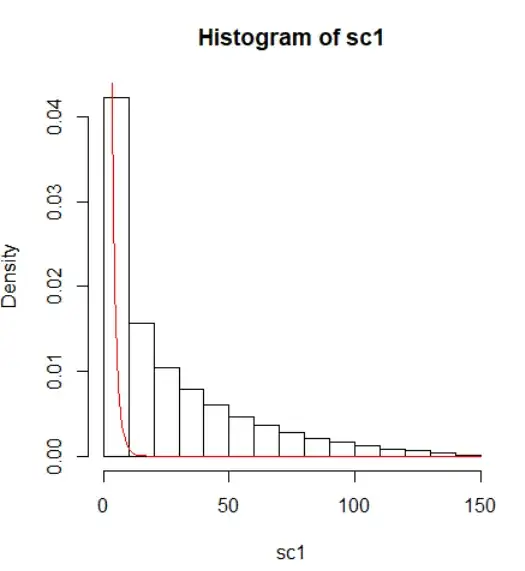
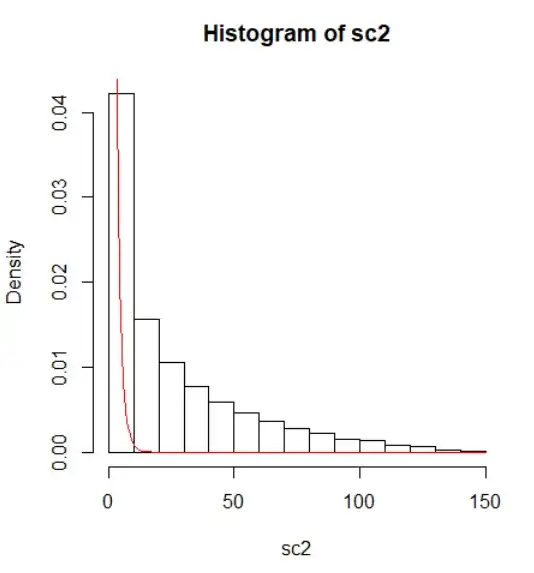
However, the obtained distributions are far from the chi-square distribution with 1 degree of freedom. But, the distributions obtained by these two methods seem to be consistent.
I've made further modifications to the Box 1's code that fix the marginal total, but these still seems to be far from the chi-square distribution of degree of freedom 1.(See Box.2 and Fig.3)
My Question
How can we vary TA and TB, or somethings to obtain a chi-square distribution with 1 degree of freedom?
The distribution obtained by the method using random value is shown in Fig.1.

Fig.1
The distribution obtained by the method based on round robin is shown in Fig.2.

Fig.2
In the both Figures, red line represents chi-square distribution with 1 degree of freedom.
Box1:
#main function
chiq_2by2<-function(TA,TB,FA,FB){
  nA=TA+FA;nB=TB+FB; ntot=nA+nB
  nF=FA+FB;nT=TA+TB
  ETA=(nT*nA)/ntot;EFA=(nF*nA)/ntot
  ETB=(nT*nB)/ntot;  EFB=(nF*nB)/ntot

  ch=((TA-ETA)^2)/(ETA);ch=ch+((TB-ETB)^2)/(ETB)
  ch=ch+((FA-EFA)^2)/(EFA);ch=ch+((FB-EFB)^2)/(EFB)
  return(ch)
}


#The method using random value
A_tot=100;B_tot=50

numb=10000
sc1<-numeric(numb)
for(i in 1:numb){
  TA=floor(runif(1, min=0, max=A_tot));  FA=A_tot-TA
  TB=floor(runif(1, min=0, max=B_tot));  FB=B_tot-TB
  sc1[i]=chiq_2by2(TA,TB,FA,FB)
}

#The method based on round robin.
A_tot=100; B_tot=50
sc2<-numeric(A_tot*B_tot);cnt=0
for(i in 0:A_tot){
  for(j in 0:B_tot){
    TA=i;  FA=A_tot-TA
    TB=j;    FB=B_tot-TB
    cnt=cnt+1
    sc2[cnt]=chiq_2by2(TA,TB,FA,FB)
  }
}

#Drawing Histograms and Distributions
par(mfrow=c(1,2))

hist(sc1 ,freq=F);curve(dchisq(x,1),col="red",add=T)
hist(sc2 ,freq=F,col="#edae00");curve(dchisq(x,1),col="red",add=T)
Box 2
#main function
chiq_2by2<-function(TA,TB,FA,FB){
  nA=TA+FA;nB=TB+FB; ntot=nA+nB
  nF=FA+FB;nT=TA+TB
  ETA=(nT*nA)/ntot;EFA=(nF*nA)/ntot
  ETB=(nT*nB)/ntot;  EFB=(nF*nB)/ntot

  ch=((TA-ETA)^2)/(ETA);ch=ch+((TB-ETB)^2)/(ETB)
  ch=ch+((FA-EFA)^2)/(EFA);ch=ch+((FB-EFB)^2)/(EFB)
  return(ch)
}

#The method using random value(2)
n_A=140
n_B=60
n_T=130
n_F=n_A+n_B-n_T

numb=10000
sc3<-numeric(0)

A_tot=n_A;B_tot=n_B
for(i in 1:numb){
  TA=floor(runif(1, min=0, max=A_tot));  FA=A_tot-TA
  TB=floor(runif(1, min=0, max=B_tot));  FB=B_tot-TB

  br1<-(TA+TB==n_T);br2<-(FA+FB==n_F)
  br3<-(TA+FA==n_A);br4<-(TB+FB==n_B)
  br=br1*br2*br3*br4

  if (br==1){
    cnt=cnt+1
    sc3=c(sc3,chiq_2by2(TA,TB,FA,FB))
  }
}

#Round robin (2)
n_A=140
n_B=60
n_T=130
n_F=n_A+n_B-n_T


sc4<-numeric(0);cnt=0
A_tot=n_A; B_tot=n_B
for(i in 0:A_tot){
  for(j in 0:B_tot){
    TA=i;  FA=A_tot-TA
    TB=j;    FB=B_tot-TB

    br1<-(TA+TB==n_T);br2<-(FA+FB==n_F)
    br3<-(TA+FA==n_A);br4<-(TB+FB==n_B)
    br=br1*br2*br3*br4

    if (br==1){
    cnt=cnt+1
    sc4=c(sc4,chiq_2by2(TA,TB,FA,FB))
    }
  }
}


#Round robin (3)
n_A=140
n_B=60
n_T=130
n_F=n_A+n_B-n_T

TAmax=min(n_T,n_A)


for(TA in 0: TAmax){
FA=n_A-TA;TB=n_T-TA;FB=n_B-TB
br1<-(FA>=0);br2<-(TB>=0);br3<-(FB>=0)
br=br1*br2*br3
if (br==0){TA_min=TA}
}
TA_min=TA_min+1


TA_max=TA_min
for(TA in TA_min: TAmax){
  FA=n_A-TA;TB=n_T-TA;FB=n_B-TB
  br1<-(FA>=0);br2<-(TB>=0);br3<-(FB>=0)
  br=br1*br2*br3
  if (br==1){TA_max=TA}
}
TA_max-TA_min

cnt=0
sc5<-numeric(TA_max-TA_min+1)
for(TA in TA_min: TA_max){
  FA=n_A-TA;TB=n_T-TA;FB=n_B-TB
  cnt=cnt+1
  sc5[cnt]=chiq_2by2(TA,TB,FA,FB)
}


#Drawing Histograms and Distributions
par(mfrow=c(2,2))
hist(sc3 ,freq=F);curve(dchisq(x,1),col="red",add=T)
hist(sc4 ,freq=F);curve(dchisq(x,1),col="red",add=T)
hist(sc5 ,freq=F);curve(dchisq(x,1),col="red",add=T)


