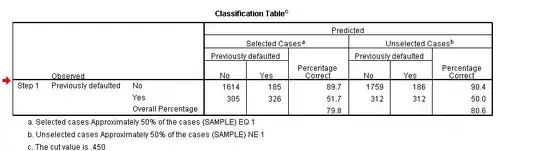
In SPSS output there is a pretty little classification table available when you perform a logistic regression, is the same possible with R? If so, how?
In SPSS output there is a pretty little classification table available when you perform a logistic regression, is the same possible with R? If so, how?
I'm not aware of a specific command, but this might be a start:
# generate some data
> N <- 100
> X <- rnorm(N, 175, 7)
> Y <- 0.4*X + 10 + rnorm(N, 0, 3)

# dichotomize Y
> Yfac <- cut(Y, breaks=c(-Inf, median(Y), Inf), labels=c("lo", "hi"))

# logistic regression
> glmFit <- glm(Yfac ~ X, family=binomial(link="logit"))

# predicted probabilities
> Yhat <- fitted(glmFit)

# choose a threshold for dichotomizing according to predicted probability
> thresh  <- 0.5
> YhatFac <- cut(Yhat, breaks=c(-Inf, thresh, Inf), labels=c("lo", "hi"))

# contingency table and marginal sums
> cTab <- table(Yfac, YhatFac)
> addmargins(cTab)
        YhatFac
Yfac   lo  hi Sum
  lo   36  14  50
  hi   12  38  50
  Sum  48  52 100

# percentage correct for training data
> sum(diag(cTab)) / sum(cTab)
[1] 0.74