3

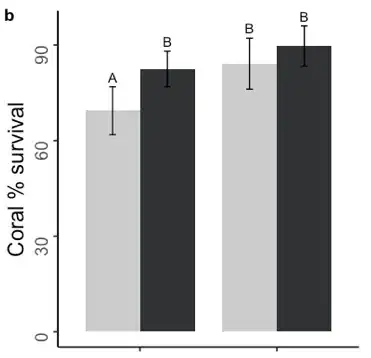
I plotted the means and 95% confidence intervals for survival data with the paired bars corresponding to 2 different study sites that each contain two experimental treatments (white = low shelter, black = high shelter). As you can see for the Waikiki site (bars on the left), the 95% CI do not overlap as confirmed by the upper and lower limits that define the error bars in the summary dataframe below.
enter image description here enter image description here

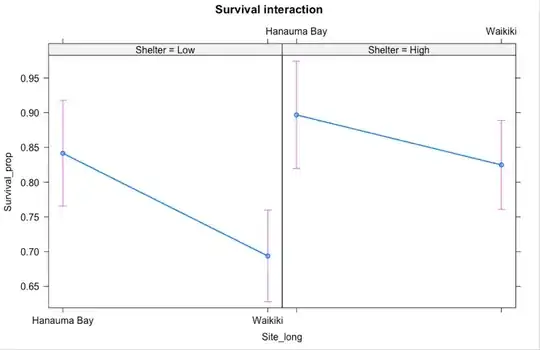
However, when I run the mixed model for these data, the Site_long x Shelter term is not significant despite the confidence intervals in the figure.

Linear mixed model fit by REML. t-tests use Satterthwaite's method ['lmerModLmerTest']
Formula: Survival_prop ~ Site_long * Shelter + (1 | Season) + (1 | Year)
   Data: survival_results_long_2

REML criterion at convergence: 21.7

Scaled residuals: 
    Min      1Q  Median      3Q     Max 
-3.6051 -0.5895  0.3570  0.6512  1.4160 

Random effects:
 Groups   Name        Variance Std.Dev.
 Season   (Intercept) 0.001181 0.03437 
 Year     (Intercept) 0.002929 0.05412 
 Residual             0.058588 0.24205 
Number of obs: 194, groups:  Season, 4; Year, 3

Fixed effects:
                            Estimate Std. Error        df t value Pr(>|t|)    
(Intercept)                  0.88820    0.04549   3.74510  19.524 6.62e-05 ***
Site_longWaikiki            -0.11677    0.03537 186.17978  -3.301  0.00115 ** 
Shelter.L                    0.03558    0.03813 186.39549   0.933  0.35191    
Site_longWaikiki:Shelter.L   0.05540    0.04992 185.81545   1.110  0.26852    
---
Signif. codes:  0 ‘***’ 0.001 ‘**’ 0.01 ‘*’ 0.05 ‘.’ 0.1 ‘ ’ 1

Correlation of Fixed Effects:
            (Intr) St_lnW Shlt.L
Site_lngWkk -0.462              
Shelter.L    0.008 -0.010       
St_lngW:S.L -0.008 -0.003 -0.764

Is the correct interpretation to say that since the 95% CI bars don't overlap AND the Tukey pairwise multiple comparisons confirm that the means for Waikiki-Low (white bar on left) and Waikiki-High (black bar on left) shelter treatments are significantly different that this interaction is significant despite the model results?

contrast                           estimate     SE  df t.ratio p.value
 Hanauma Bay Low - Waikiki Low        0.1559 0.0501 186  3.111  0.0115 
 Hanauma Bay Low - Hanauma Bay High  -0.0503 0.0541 187 -0.930  0.7887 
 Hanauma Bay Low - Waikiki High       0.0273 0.0497 186  0.549  0.9467 
 Waikiki Low - Hanauma Bay High      -0.2063 0.0505 186 -4.083  0.0004 
 Waikiki Low - Waikiki High          -0.1287 0.0456 185 -2.823  0.0269 
 Hanauma Bay High - Waikiki High      0.0776 0.0501 187  1.550  0.4100 

For completeness, I have also provided the model outputs for the simple linear model with and without the interaction term between Site and Shelter:

Simple linear model with interaction term

Call:
lm(formula = Survival_prop ~ Site_long * Shelter, data = survival_results_long_2, 
    na.action = "na.fail")

Residuals:
    Min      1Q  Median      3Q     Max 
-0.8967 -0.1581  0.1033  0.1584  0.3062 

Coefficients:
                           Estimate Std. Error t value Pr(>|t|)    
(Intercept)                 0.86915    0.02748  31.631   <2e-16 ***
Site_longWaikiki           -0.10989    0.03601  -3.052   0.0026 ** 
Shelter.L                   0.03899    0.03886   1.003   0.3169    
Site_longWaikiki:Shelter.L  0.05364    0.05092   1.053   0.2935    
---
Signif. codes:  0 ‘***’ 0.001 ‘**’ 0.01 ‘*’ 0.05 ‘.’ 0.1 ‘ ’ 1

Residual standard error: 0.2473 on 190 degrees of freedom
Multiple R-squared:  0.08609,   Adjusted R-squared:  0.07166 
F-statistic: 5.966 on 3 and 190 DF,  p-value: 0.0006584

enter image description here

Simple linear model without the interaction term

Call:
lm(formula = Survival_prop ~ Site_long + Shelter, data = survival_results_long_2, 
    na.action = "na.fail")

Residuals:
     Min       1Q   Median       3Q      Max 
-0.91909 -0.14268  0.08091  0.18023  0.28998 

Coefficients:
                 Estimate Std. Error t value Pr(>|t|)    
(Intercept)       0.86943    0.02748  31.634  < 2e-16 ***
Site_longWaikiki -0.10974    0.03602  -3.047  0.00264 ** 
Shelter.L         0.07023    0.02512   2.796  0.00571 ** 
---
Signif. codes:  0 ‘***’ 0.001 ‘**’ 0.01 ‘*’ 0.05 ‘.’ 0.1 ‘ ’ 1

Residual standard error: 0.2473 on 191 degrees of freedom
Multiple R-squared:  0.08076,   Adjusted R-squared:  0.07113 
F-statistic:  8.39 on 2 and 191 DF,  p-value: 0.0003219

enter image description here

All input is appreciated thank you!

enter image description here

Eric Dilley
  • 135
  • 5
  • You are fitting crossed random intercepts for two groups, one of which has 4 levels and the other has 3. This means you are asking the software to estimate variances for two variables that have only 4 and 3 observations respectively. This is not a good idea. You could fit random intercepts for the `year:season` interaction, and/or you might need to include them as fixed effects. – Robert Long Aug 12 '20 at 18:45

1 Answers1

3

There are a few things going on here. First, non-overlap of 95% confidence intervals (CI) is generally much more stringent than is required for a significant difference between two means. This answer shows that under reasonable conditions such non-overlap is equivalent to about p < 0.005 for the difference in means. There is little question for example that there is a difference between high shelter and low shelter at the Waikiki site.

Second, as a comment on an earlier version of this answer states:

When removing the interaction, both Site and Shelter come out significant ...

That argues that the anomaly isn't so much with the Waikiki site as with the Hanauma site. With an overall difference between high shelter and low shelter in the model without an interaction, one might expect to find a shelter difference for the Hanauma site, too. You don't see that in the evidently raw data in the bar plots and the first table. Raw data comparisons, however, aren't the same thing as comparing coefficients in regression models.

One point of a linear model is to share information about the underlying error terms among all of the conditions. That makes it possible to see differences that are hidden because of random variation within individual combinations of conditions, like the high shelter versus low shelter values at Hanauma. If the model had stopped at that point, one could have analyzed estimated marginal means in a way that would presumably show significant (high shelter - low shelter) differences for both Waikiki and Hanauma, both differences equal to the regression coefficient for Site in the additive model without the interaction.

Third, adding the interaction term is an attempt to look for further differences in the Shelter effect between the two sites. The interaction term isn't just looking at whether high shelter and low shelter differ at Waikiki. It's looking at whether that difference differs from the difference seen at Hanauma. That's both a mouthful to say and a lot to think about, but understanding interactions requires a lot of careful thought. That interaction term--the difference between the differences--isn't even displayed in the bar plot or the first table.

In this case, adding the interaction effect loses the apparent overall "significance" of Shelter while not providing a "significant" interaction term. That result suggests that there simply aren't enough data to support the search for the interaction term. I suspect that an ANOVA test between the models with and without the interaction would have been non-significant, in which case the data would be most efficiently and accurately represented by the additive model.

This type of behavior can be seen in situations in which some of the effects are on the borderline of significance. That seems to be the case here for the overall Shelter effect in the additive model. Then the attempt to break down the Shelter effect into separate effects for the two sites with the interaction, plus the loss of a degree of freedom for the statistical tests, ends up confusing more than clarifying.

With these data, I'd recommend just sticking with the additive model if possible. If your original hypothesis specifically included the interaction, you simply didn't collect enough data to decide on that. Then it might make sense to show results for both the additive and the interaction model.

Finally, do pay attention to the structure of the random-effects parts of the model, as noted in a comment. And if these are percentage survival values you perhaps shouldn't be using a standard linear regression as this seems to be, although in some circumstances (e.g., with limited probability ranges far enough on average from the limits of 0 and 1) such a linear probability model can sometimes be good enough.

EdM
  • 57,766
  • 7
  • 66
  • 187
  • For your first point, based on the confidence intervals there is a difference for Waikiki Low x High shelter comparison while the difference at Hanauma Bay is insignicant. I still do not understand why this wouldn't yield a significant interaction. Secondly the data represents the estimates for the simplified linear model (Survival ~ Site x Shelter) in which the interaction term is still not significant. Thirdly, do you have any suggestions for a regression model to use? Do you think betaregression might be more appropriate? – Eric Dilley Aug 13 '20 at 02:17
  • @EricDilley that's the type of thing that can happens when the values of the statistics are on the edge of significance. Sometimes the extra degree of freedom that you lose by including an interaction makes it harder to find significance, particularly in a case like this where there's a hint of lower survival in `low shelter` at both sites so any further difference due to site would be hard to distinguish. If no data are exactly 0% or 100% beta regression could be better, or you could do a logistic regression or, with count data having small numbers of counts, a Poisson-type regression. – EdM Aug 13 '20 at 02:36
  • These data range from 0 to 1 including zeroes and ones. I have used the gamlss package with famiy = BEINF() and still got the same result despite a better model fit. The interaction term p-value increased relative to my other models. When removing the interaction, both Site and Shelter come out significant because of the significant difference by 95% CI between Low Shelter at both sites. But again, the fact that there is no overlap in the CI for the Low and High Shelter modules at Waikiki is still confusing to me. I thought that the 95% CI when not overlapping are significantly different – Eric Dilley Aug 13 '20 at 02:56
  • EdM If I understand you correctly, your third point in your provided answer is exactly what I am referring to. Because the difference between low-high shelter at Waikiki appears significant based on 95% CI and that difference is not significant for Hanauma Bay again based on CI, the interaction term should be significant no? And based on the sample sizes provided in my summary table (min = 41, max = 50) you think there are not enough data to find this interaction significant despite the 95% CI not overlapping? My hang up is the CI because these should be characterizing variability – Eric Dilley Aug 13 '20 at 19:44
  • EdM I have added the model outputs for the simple linear model with and without the interaction term to the original question post for your reference in regards to coefficient values related to the simple linear model. – Eric Dilley Aug 13 '20 at 19:54
  • @EricDilley as I expected, thanks for the addition. I have seen this type of thing embarrassingly often when I try to push limited data too far with an interaction term. If you do an ANOVA test between the 2 models, I'm pretty sure that the interaction model won't be significantly better than your additive model without the interaction. The additive model might be further improved by including random effects or by using a modeling approach other than this linear probability model. Unless you can get a lot more data, stick with the additive model and leave the interaction term behind. – EdM Aug 13 '20 at 20:09
  • @EricDilley the CI you are looking at seem to be for raw data rather than model results. The additive model shows a significant `low` versus `high` Shelter difference of about 0.07 units, for _both_ Sites. Compared to that pooled error estimate from the additive model, the error bars in the plot might be too tall for Hanauma and too short for Waikiki. so they aren't providing the same information as the model. There are too few observations to gauge whether, say, the difference for Waikiki is really 0.10 while that for Hanauma is really 0.04, which is what an interaction would represent. – EdM Aug 13 '20 at 20:24
  • EdM Can you clarify what you mean by the raw data vs the model data? The reason I ask is the summary database provided are the means calculated from the raw data that were used in all the models I have provided. Therefore I do not quite understand quantitatively what the difference is here and why the interaction term is not at least close to the p < 0.05 – Eric Dilley Aug 13 '20 at 20:41
  • Also I have added the effects plots to these analyses for comparison to the bar chart I produced originally – Eric Dilley Aug 13 '20 at 20:45
  • Let us [continue this discussion in chat](https://chat.stackexchange.com/rooms/111777/discussion-between-eric-dilley-and-edm). – Eric Dilley Aug 13 '20 at 21:24
  • EdM in case you didn't see I added a few comments about resolving your solution in the chat and just wanted to make sure you see them. I can give you credit for resolving this if you just update your answer to include what you said in the chat. Thanks! – Eric Dilley Aug 13 '20 at 22:16