I have read in several papers that the Richards equation
is one of the most popular choices to model epidemiologic data. I translated the equation in R's terms:
y = r * x * (1-(x/k)^a)
with y being the infected number at time t, x being the infected at time t-1.
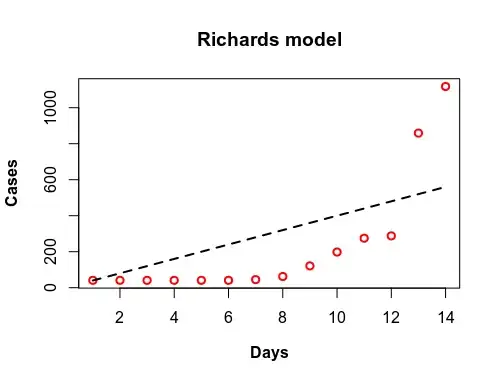
I got the COVID cumulative infections from China between 10 and 23 January and I tried to assign some initial value but I can't find values that fit the data:

Since the data is not sigmoid, I even tried to extend the period up to present-day but, again, I get linear fitting instead that sigmoid:
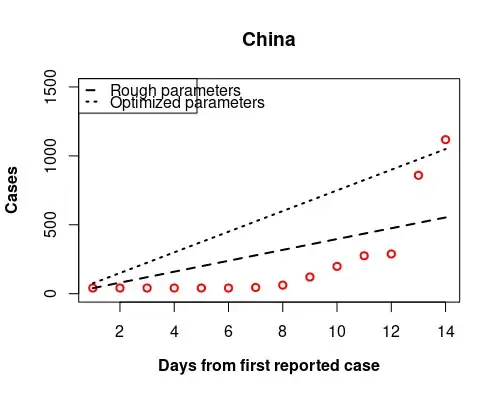
Even with optimization using nonlinear least squares, I do not obtain a curve but a line:

Is the Richards equation truly a good choice for these data (in particular in the first case)?
What values turn this equation from a line to a curve?
Is the translation of the equation into code correct?
Thank you

