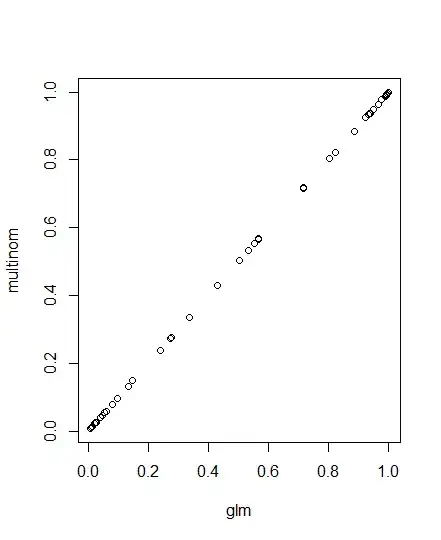
I'm trying to understand the differences I see when applying multinomial logistic regression models in R using nnet and mgcv. For comparison purposes with glm() let's take only two levels for the dependent variable. The additive model success ~ numeracy + anxiety retrieves identical results for all approaches. However for the interaction term nnet generates very different results as compared to the other two.
A <- structure(list(numeracy = c(6.6, 7.1, 7.3, 7.5, 7.9, 7.9, 8,
8.2, 8.3, 8.3, 8.4, 8.4, 8.6, 8.7, 8.8, 8.8, 9.1, 9.1, 9.1, 9.3,
9.5, 9.8, 10.1, 10.5, 10.6, 10.6, 10.6, 10.7, 10.8, 11, 11.1,
11.2, 11.3, 12, 12.3, 12.4, 12.8, 12.8, 12.9, 13.4, 13.5, 13.6,
13.8, 14.2, 14.3, 14.5, 14.6, 15, 15.1, 15.7), anxiety = c(13.8,
14.6, 17.4, 14.9, 13.4, 13.5, 13.8, 16.6, 13.5, 15.7, 13.6, 14,
16.1, 10.5, 16.9, 17.4, 13.9, 15.8, 16.4, 14.7, 15, 13.3, 10.9,
12.4, 12.9, 16.6, 16.9, 15.4, 13.1, 17.3, 13.1, 14, 17.7, 10.6,
14.7, 10.1, 11.6, 14.2, 12.1, 13.9, 11.4, 15.1, 13, 11.3, 11.4,
10.4, 14.4, 11, 14, 13.4), success = c(0L, 0L, 0L, 1L, 0L, 1L,
0L, 0L, 1L, 0L, 1L, 1L, 0L, 1L, 0L, 0L, 0L, 0L, 0L, 1L, 0L, 0L,
1L, 1L, 1L, 0L, 0L, 0L, 1L, 0L, 1L, 0L, 0L, 1L, 1L, 1L, 1L, 1L,
1L, 1L, 1L, 1L, 1L, 1L, 1L, 1L, 1L, 1L, 1L, 1L)), .Names = c("numeracy",
"anxiety", "success"), row.names = c(NA, -50L), class = "data.frame")

library(nnet)
library(mgcv)

model1 <- glm(success ~ numeracy * anxiety, binomial, data=A)
summary(model1)
#Coefficients:
#                 Estimate Std. Error z value Pr(>|z|)
#(Intercept)       0.87883   46.45256   0.019    0.985
#numeracy          1.94556    4.78250   0.407    0.684
#anxiety          -0.44580    3.25151  -0.137    0.891
#numeracy:anxiety -0.09581    0.33322  -0.288    0.774

model2 <- gam(list(A$success~A$numeracy*A$anxiety),family=mgcv::multinom(K=1))
summary(model2)
#Parametric coefficients:
#                     Estimate Std. Error z value Pr(>|z|)
#(Intercept)           0.87883   46.45422   0.019    0.985
#A$numeracy            1.94556    4.78272   0.407    0.684
#A$anxiety            -0.44580    3.25162  -0.137    0.891
#A$numeracy:A$anxiety -0.09581    0.33324  -0.288    0.774

model3 <- nnet::multinom(success ~ numeracy*anxiety, data = A)
summary(model3)
#Coefficients:
#                      Values  Std. Err.
#(Intercept)       0.69335106 0.07083273
#numeracy          1.96445284 0.70967242
#anxiety          -0.43283777 0.16992672
#numeracy:anxiety -0.09712809 0.04876127
z <- summary(model3)$coefficients/summary(model3)$standard.errors
p <- (1 - pnorm(abs(z), 0, 1)) * 2
p
#     (Intercept)         numeracy          anxiety numeracy:anxiety
#     0.000000000      0.005638205      0.010859038      0.046380895
