7

I need to know what probability distribution represents one variable of my dataset. I've tried some tools in R, such as, rriskDistribution or fitdistrplus and no-results have found. The size is about 26000.

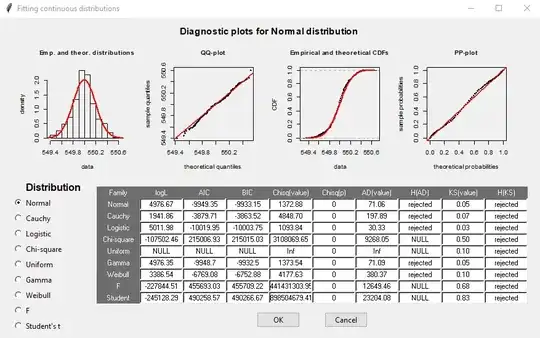
It seems to be a normal but I carried out some test and failed. I give you some examples:

enter image description here

enter image description here

]enter image description here

enter image description here

]

whuber
  • 281,159
  • 54
  • 637
  • 1,101
Stats
  • 71
  • 1
  • 8
    Could you explain why you need to know this? It's fairly rare for this kind of blind distribution-fitting to be an important or even useful element of a statistical analysis. – whuber Apr 22 '20 at 16:30
  • 1
    @whuber I want to create randomly an small dataset with their characteristics. – Stats Apr 22 '20 at 16:32
  • 1
    What do you mean by 'what should I do'? This depends on your main goal, there's probably something better you can do trying to force-fit a distribution. – Vyraj Apr 22 '20 at 16:32
  • 1
    With such a large dataset of 26000 values, why not just sample it directly? – whuber Apr 22 '20 at 16:33
  • @Vyraj Is there a possibility to create a dataset with the same characteristics without knowing the distribution? – Stats Apr 22 '20 at 16:35
  • @whuber Because I have to create different datasets, First of all, one sample with these characteristics. Then, different samples with the same characteristics + drift – Stats Apr 22 '20 at 16:36
  • 5
    Just bootstrap it – dlnB Apr 22 '20 at 16:37
  • 7
    “Just bootstrap it” means to treat the data as a population and draw samples from your data WITH REPLACEMENT. The gist of bootstrap is that, if you can’t draw more samples from the original population, drawing samples from the empirical distribution is the next-best option. – Dave Apr 22 '20 at 16:51
  • 4
    You refer to wanting to create a "small" dataset. Let's suppose that would be $m$ values. There are nearly $(26000)^m/m!$ (unordered) samples you can draw from your dataset. For any $m$ larger than $2$ this is such a large number that you will never run out of possibilities. – whuber Apr 22 '20 at 17:04

3 Answers3

11

If you have 26K data, any test on a given distribution will fail. Because for that much data, the testing can detect tiny difference and report it is not coming from that distribution.

I would strongly recommend you to read these posts

Are large data sets inappropriate for hypothesis testing?

Is normality testing 'essentially useless'?


It is very common that data is not coming from any distribution in text book. But we still can do a lot with it.

For example we can fit data with Mixture of Gaussian model.


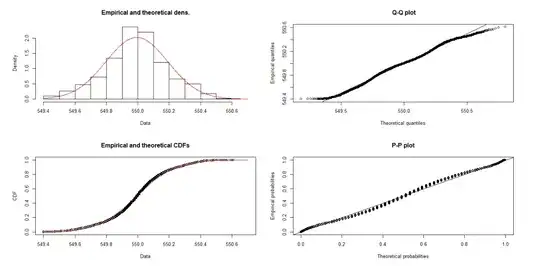
In addition, the distribution of your data seems too good (that coming from normal distribution) that may be coming from some simulation but not from the real world. I would suggest to do following thing: draw 26K sample from normal distribution and run the hypothesis test and all the plots to see the results. This is probability what was happening in your case.
Haitao Du
  • 32,885
  • 17
  • 118
  • 213
  • 1
    Agreed. It also really depends what your are trying to accomplish. I would say that with the look of your plots, I would probably be comfortable treating the data as normal. However, you have such a large data set that traditional P-value test are essentially useless. Any test will be significant. You have entered the machine learning-zone. – Tanner Phillips Apr 22 '20 at 16:58
  • @MISC Well, this dataset comes from measurements of Turbine After Temperature. I'm going to create the different datasets assuming normal distribution. – Stats Apr 22 '20 at 17:38
0

You could use Mathematica's FindDistribution command, but the person above who said that with so much data you are unlikely to see any test report that the data is Normal was absolutely correct. However, FindDistribution almost certainly will return one or more (mixture) distributions that fit fairly well. I had a similar problem and used Tukey's Fences (Wikipedia) to determine that about 18% of my very large data set was outliers. It took several months of on and off reflection and reading for me to figure out where the outliers were coming from. I suggest that you spend whatever time it takes to develop an accurate mental and/or pictorial model of what is going on in the process so that you can explain everything that is going on in your process, including outliers, with a theory.

CElliott
  • 123
  • 4
-4

You got just Two options here:

1.Create a database which fits a distribution.! 2.divide your database (hope it will fit) and run them concurrently and merge later as per your requirement