I am using the Lmer function from the lmerTest in R to test the significant of fixed effects [Training (2 levels factor: H/GD) & Value (2 levels factor:D/ND)] on % of responses (numeric: ResTest), with a repeated mesures design (20 subjects tested in the 4 conditions: H/D, H/ND, GD/D, GD/ND = 4 observation / subject).
Here is my model, with Subject as a random factor:
mymodel <- lmer(ResTest~Value + Training + Value:Training + (1|Subject), data = Data)
This what the summary gives me:
Residuals are symmetrical, all fixed effects are significant.
Using the r.squaredGLMM(mymodel) I obtained the R2 for the model, which is 0.9873067.
I then run diagnostics of my model, first checking for the normality of my residuals, using qqnorm(residuals(mymodel), ylab="Residuals for mymodel") & qqline(residuals(mymodel)) . That is what I get and where problems begins: my residuals are heavy tailed.
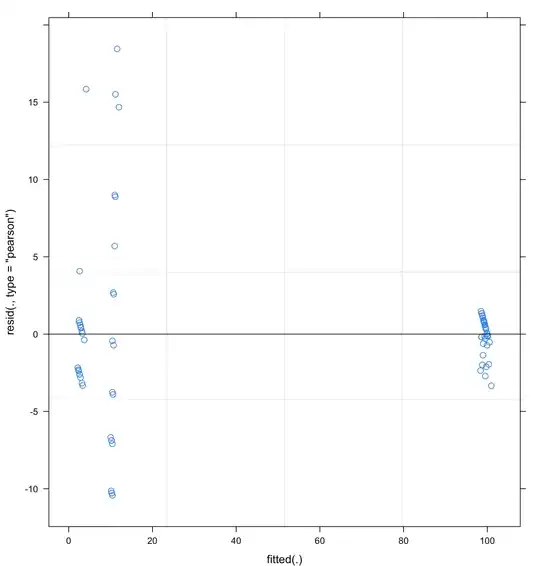
Plus, when I plot the residuals vs fitted, there is some large y axis data point and data point don't tend to cluster towards the middle of the plot at all. But I mean, my data are like this, with two of the conditions inducing almost always 100 % of responses and the 2 others inducing near 0% of responses and nothing in the middle.
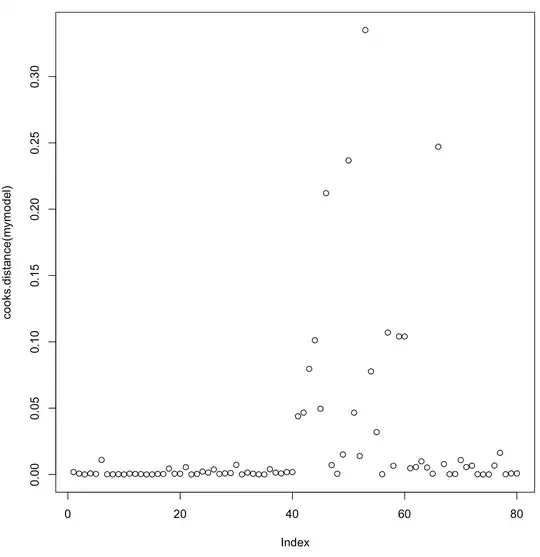
I tried to asses the impact of some of my data point with plot(cooks.distance(mymodel)) to see if there is something here, but it's seems that no data point have an excessive influence on my model.
With all of this, I am not sure how I can trust my model (and the very good R squared) and I really would like to improve it (and understand it). Have I gone in a completely bad direction ?
Also, is there a reason why I should use lmer instead of lme ? Because I have seen this heavy package, with the heavyLme fonction ("This function fits a linear mixed-effects model under heavy-tailed errors using the formulation described in Pinheiro et al. (2001)").
So I tried my model like this:
model <- lme(ResTest~Value + Training, random = ~1|Subject, data = Data)
and obtained same results.
I tried to do the heavyLme fonction, but it didn't work because I don't get what is this "groups" argument...
mymodelheavy <- heavyLme(ResTest~Value + Training + Value*Training ,
                         random = ~Subject, groups = ~ ?,  data = Data)
Here is the density graph of my dependent variable (% of responses), using plot(density(Data$ResTest)).
and here is a plot density of the residuals of my lmer model (plot(density(residuals(mymodel)): 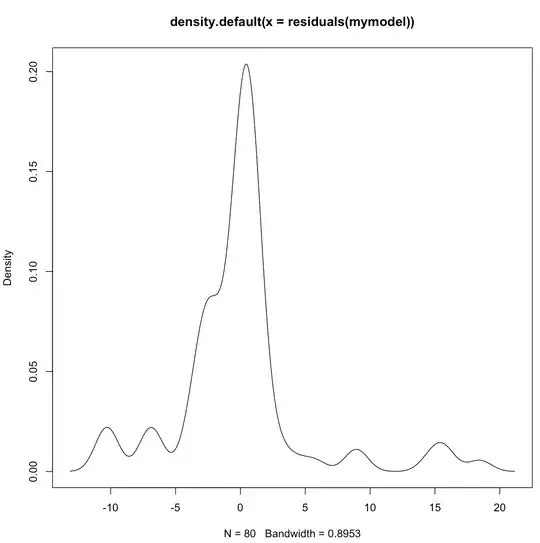
I hope someone can help me with all of this.
EDIT: My data are binomial and I should not have done lmer in the first place, but glmer with family=binomial and a logit link. Works much better that way !
