No, you did not make an error in your code (that I can see).
It is unfortunately the case that automatic ARIMA model selection rarely recovers the model that was used to simulate the input data. This is simply a consequence of there usually being very little data compared to the number of parameters to be estimated. After all, we can't just count the two AR parameters the true data generating process used - auto.arima() searches through many different possible models. And if seasonality might be an issue, the number of possible models increases yet further.
I have long had a nagging suspicion that the main reason why ARIMA is popular is not because it does a great job in modeling real time series, but because it is a time series model that you can actually prove mathematical theorems about. (Exponential smoothing, as an alternative, used to be mainly a heuristic, and was only put on solid mathematical grounds via state space models about 15 years ago.) This suspicion of mine is reinforced by the description of how the original forecasting competition by Makridakis - where ARIMA method already performed poorly - was received by statisticians (Hyndman, 2020, IJF - very much recommended):
Many of the discussants seem to have been enamoured with ARIMA models. ... At times, the discussion degenerated to questioning the competency of the authors.
Also, it seems like there are few truly convincing real-life examples of moving average processes. If you restricted your search to AR(p) models only, auto.arima() might be better at finding the true model. And even then, the parameters would only be estimated and differ from the true values, of course.
Note that I do not think this is a shortcoming of the auto.arima() implementation. Quite to the contrary. There are few approaches to fitting ARIMA models that I would trust more. Rob Hyndman is probably the one person who knows most about this. For instance, I would not assume that a Box-Jenkins approach would be better.
In any case, what you did is a great exercise to understand the shortcomings of ARIMA fitting. I wish many more time series analysis and forecasting courses included such a short lesson in humility. I would encourage you to play around a little more with your approach, maybe include seasonal models, or other AR or even MA parameters, or allow or disallow the Box-Cox transformation.
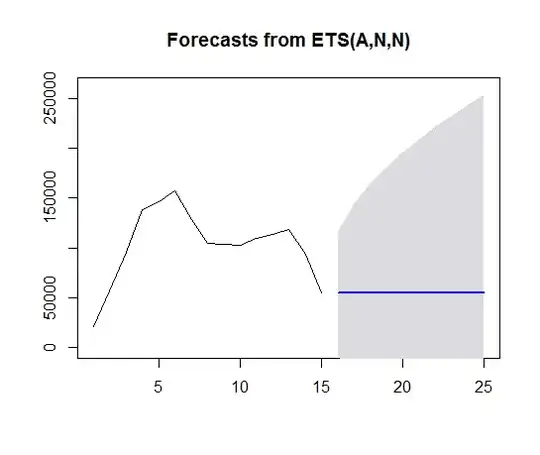
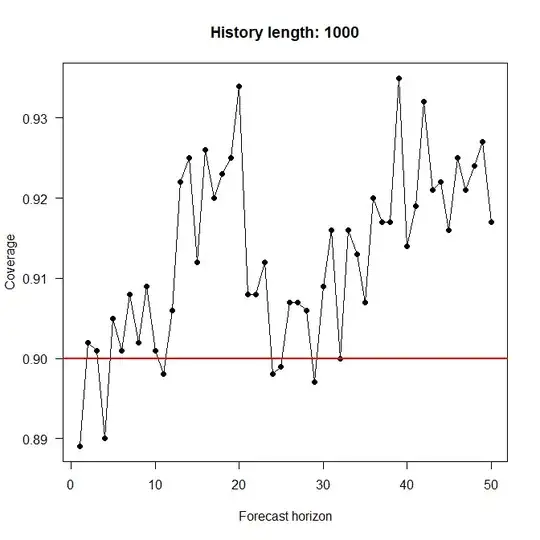
All that said, why do you want to fit an ARIMA model? Most people will want to do so to forecast. (Yes, there are also other motivations.) In this case, it would make sense to expand your experiments to also include the forecasting step. This is what I do below. I simulated 100 (or 1000) historical data points plus 50 holdout data points using arima.sim(), then fitted an ARIMA model using auto.arima(), calculated 90% interval forecasts using forecast(), counted how often these interval forecasts covered the true value and finally plotted the average coverage against the forecast horizon. Results and code are below. It would seem to me that at least the interval forecasts are "good enough". (The apparent upward trend in the plot for a history length of 100 looks intriguing. I don't know where it comes from.)
library(forecast)
n_sims <- 1000
n_history <- 100
n_forecast <- 50
true_model <- list(ar=c(0.3,0.5))
confidence_level <- 0.9
hit <- matrix(NA,nrow=n_sims,ncol=n_forecast)

pb <- winProgressBar(max=n_sims)
for ( ii in 1:n_sims ) {
    setWinProgressBar(pb,ii,paste(ii,"of",n_sims))
    set.seed(ii)    # for reproducibility
    actuals <- arima.sim(model=true_model,n=n_history+n_forecast)
    model <- auto.arima(actuals[1:n_history])
    fcst <- forecast(model,h=n_forecast,level=confidence_level)

    hit[ii,] <- fcst$lower<=tail(actuals,n_forecast) & tail(actuals,n_forecast)<=fcst$upper
}
close(pb)

coverage <- apply(hit,2,sum)/n_sims
plot(coverage,xlab="Forecast horizon",ylab="Coverage",las=1,
    main=paste("History length:",n_history),
    type="o",pch=19,ylim=range(c(coverage,confidence_level)))
abline(h=confidence_level,lwd=2,col="red")
An alternative you might want to explore would be to compare the expectation point forecast against various possible "optimal" cases, e.g.:
- against the point forecast if the true model is known (including the parameters)
- against the point forecast if the true model and the Box-Cox transformation is known, but the parameters need to be estimated
- against the point forecast if the true model is known, but the Box-Cox transformation and the parameters need to be estimated
- against the point forecast if
auto.arima() can only choose among AR(p) models for $p=0, \dots, 5$ or so
- ...

