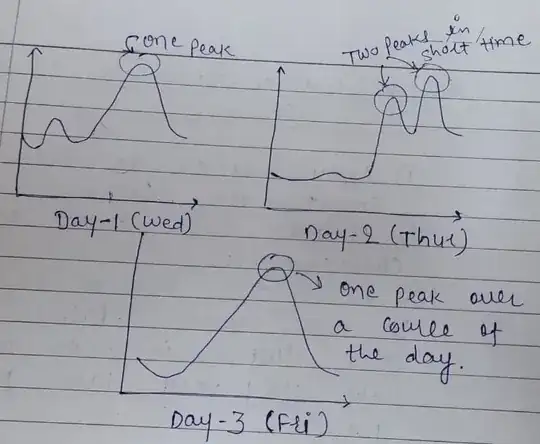
Figure 1: X-axis represents the time (0-23 hours) and Y-axis represents the electricity consumption in kWh.
I am working with time-series power consumption data. Figure 1 shows the shapes of one user on Wednesday, Thursday and Friday. All the shapes look different that indicates the stochastic behavior of that user. I want to measure this variability in load shapes. My ultimate goal is to quantify the difference in consumption patterns across days. What kind of statistical techniques I can use for the same? Is there any library/package available in python/R? Please help me in this regard.
- 23
- 4
-
What do you mean by “stochastic behavior”? – forecaster Dec 31 '19 at 04:17
-
From the three patterns shown in figure 1, the user is having random usage patterns throughout the day. Peak timing is different, two peaks in one day etc. – Rajesh Ahir Dec 31 '19 at 06:15
1 Answers
"My ultimate goal is to quantify the difference in consumption patterns across days."
To do so one needs to form useful (SARIMAX) model(s) that includes factors like hour-of-the-day , day-of-the-week , month-of-the-year , holiday effects AND possibly include environmental variables that would normally affect consumption. All of this has to be done in a robust way dealing with anomalies and incorporating Intervention Detection schemes while identify needed arima structureand validating the Gaussian assumptions .
I am currently doing some work like this on an aggregate ( i.e.all customers ) basis for an energy supplier in the UK at the 15 minute interval level. The same kind of tools can be deployed at the customer level albeit with more uncertainty due to more randomness.
If you wish you can post some of your customer usage data and any environmental data that you might have access to and time-available I will try and help further.
https://stats.stackexchange.com/search?q=user%3A3382+consumption might be of some help to you.
" Is there any library/package available in python/R? Please help me in this regard." ... There is no one free package available to solve your problem . You might have to write your own and use utilities like tsoutliers What algorithm should I use to detect anomalies on time-series? to aid the identification of latent deterministic structure BUT there are often critical assumptions in place. Read the fine print ...always "KNOW THY ASSUMPTIONS"...
- 27,906
- 5
- 29
- 55