I am really sorry about asking this question because I don't understand the first thing of how to analyze it.
Ok, so there are these sites, differentiated by SiteID, and Locality is the crop being grown there (Bluhflache and Rapsfeld). I want to examine species richness (number of different species) and Species Abundance (total number individuals in each species) and see if they are affected by LandUse. There are more species and land use columns than shown in the pictures.

The land use being either the Bluhflache or Rapsfeld crop treatment, as well as the other land use data set of a 1500 m buffer around the sites:
WHAT MY MAIN QUESTION IS, is how do I do a linear regression analysis of the species data and 1500 m buffer data shown above? I don't even know where to start. I know it is land use around each site (the independent variable), and I want to see how that influences species abundance and data (the dependent variables) on those sites, but I don't know how to compare and analyze them whatsoever. I am looking into resources online for now. I am using R.
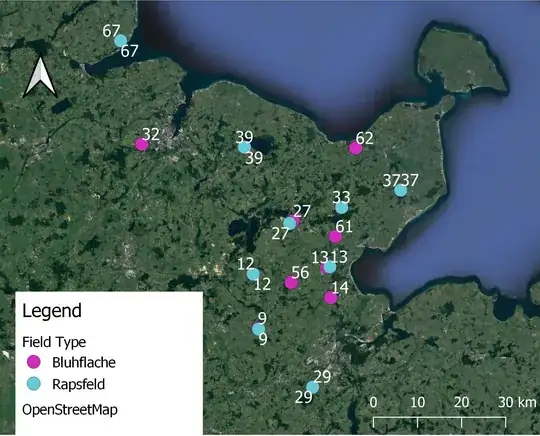
Here's a map i made of the sites if that helps at all:

Here is the GLM I've done so far just for 2017 data, which was pooled into just the site number not field type:
SpeciesAbund2017 <- apply(Pooled2017SpeciesData[,-1],1,sum)
1 204 102 176 305 241 512 106 302
Pooled2016LandUsefor2017 <- read.csv("2016LandUsePooledfor2017.csv",header=T)

SpeciesAbund2017model <- glm(SpeciesAbund2017 ~ Pooled2016LandUsefor2017$perc_forest_500 + Pooled2016LandUsefor2017$perc_arable_500 + Pooled2016LandUsefor2017$perc_seminat_500 + Pooled2016LandUsefor2017$perc_rape_500 + Pooled2016LandUsefor2017$perc_grassland_500, family = poisson)

summary(SpeciesAbund2017model)
Result:
Call:
glm(formula = SpeciesAbund2017 ~ Pooled2016LandUsefor2017$perc_forest_500 +
    Pooled2016LandUsefor2017$perc_arable_500 + Pooled2016LandUsefor2017$perc_seminat_500 +
    Pooled2016LandUsefor2017$perc_rape_500 + Pooled2016LandUsefor2017$perc_grassland_500,
    family = poisson)

Deviance Residuals:
      1        2        3        4        5        6        7        8
-7.4954  -4.9937  -7.2495   3.9528   2.2330   5.1786  -0.5689   6.5993

Coefficients:
                                            Estimate Std. Error z value
(Intercept)                                   7.8602     0.5147  15.272
Pooled2016LandUsefor2017$perc_forest_500     -3.2097     0.4934  -6.505
Pooled2016LandUsefor2017$perc_arable_500     -1.5481     0.5960  -2.598
Pooled2016LandUsefor2017$perc_seminat_500    -1.2065     1.0619  -1.136
Pooled2016LandUsefor2017$perc_rape_500       -4.7038     0.5379  -8.744
Pooled2016LandUsefor2017$perc_grassland_500  -3.6157     0.5231  -6.912
                                            Pr(>|z|)
(Intercept)                                  < 2e-16 ***
Pooled2016LandUsefor2017$perc_forest_500    7.79e-11 ***
Pooled2016LandUsefor2017$perc_arable_500     0.00939 **
Pooled2016LandUsefor2017$perc_seminat_500    0.25585
Pooled2016LandUsefor2017$perc_rape_500       < 2e-16 ***
Pooled2016LandUsefor2017$perc_grassland_500 4.78e-12 ***
---
Signif. codes:  0 ‘***’ 0.001 ‘**’ 0.01 ‘*’ 0.05 ‘.’ 0.1 ‘ ’ 1

(Dispersion parameter for poisson family taken to be 1)

    Null deviance: 483.18  on 7  degrees of freedom
Residual deviance: 224.98  on 2  degrees of freedom
AIC: 294.62

Number of Fisher Scoring iterations: 4
Does this make sense?
Also, to look at potential effects of area of forest edge (area_forestedge_###) on species data do I do a correlation test?
