Summary: Standard triplots for ecological data analyzed by canonical correspondence analysis (CCA*) provide a way to gauge both the strengths of relationships of individual environmental variables to species distributions and the similarities among environmental variables in these respects. You might, however, want to do some dimension reduction on the set of 100 environmental variables first, to minimize problems from multicollinearity and overfitting. Finally, some modifications to CCA can accommodate nonlinearities in the environmental variables, which might simplify your project overall.
Sources: This is outside my present expertise, but I find myself facing similar issues in my own work. I wrote this answer in large part to start learning about this. Most of the below is based on The Ordination Web Page (OWP), Multivariate Analysis of Ecological Data (MAED), and Correspondence Analysis in Practice (CAiP). Those sources should provide enough background in multivariate analysis for you to work effectively with a statistician having experience with this type of analysis.
Details:
Triplots:
Correspondence analysis (CA) can be considered a singular-value decomposition (SVD) of a transformed count matrix, say of species versus sites (your squares). The count for each species/site element of the matrix is first divided by the total number of counts for all species and sites. Then the matrix is standardized: expressed as residuals of these values from what would be expected if species and sites were independent, and weighted with respect to the total numbers for each site and each species. SVD of this matrix of standardized residuals provides the CA. Typically the first 2 principal coordinates (with highest singular values/eigenvalues) are selected, and values for species and sites are plotted with respect to those principal coordinates in a 2-dimensional display. This provides a way to combine information among species based on their relative distributions among sites, overcoming some concerns raised in comments.**
CCA, canonical correspondence analysis, takes this a step further by incorporating information about covariates (environmental variables) associated with each of the sites. The matrix of standardized residuals for species versus sites is regressed against the covariates (centered to 0 and normalized to unit standard deviation), restricting analysis to a "constrained" subspace that can be expressed as exact linear combinations of the covariates. SVD of this constrained subspace provides the CCA.
Now all 3 of species, sites, and covariates can be displayed with respect to the first 2 principal coordinates, providing a triplot. The contributions of the covariates can be represented as arrows, starting at the origin and ending at points proportional to their regression coefficients with respect to these 2 dimensions. This example comes from OWP:
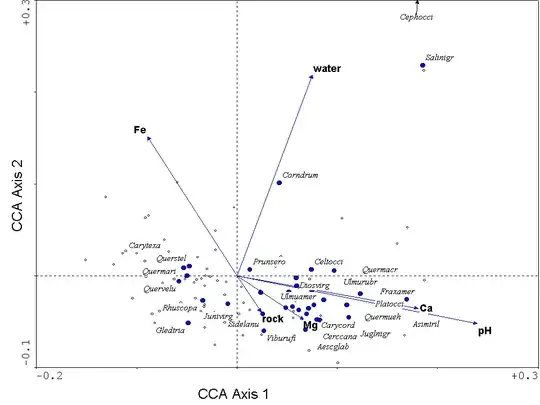
This provides the outline of a solution to your problem: the relative Euclidean lengths of the arrows represent the relative importances of covariates in terms of the species/site associations (within these dimensions of the constrained subspace). The angles between arrows represent dissimilarities among the covariates. In this example, Ca and pH are highly similar in angles, both are nearly orthogonal to water, and close to opposite in direction from Fe. So cosine similarity provides a straightforward basis for evaluating similarity among covariates. Although displayed here for 2 dimensions of CCA, you could determine Euclidean lengths and cosine similarities in as many dimensions as you choose to include in your analysis.***
Dimension reduction
The maximum dimension of CA is one less than the minimum of the number of sites or species (as the division of each individual original count value by the sum of all count adds one linear dependence). For CCA that dimension is reduced to the number of covariates, which in many examples is less than either the numbers of species or sites. In your case, however, the 100 environmental variables are similar to the number of species; as you note, many of those variables are highly correlated. I would fear problems arising from multicollinearity and overfitting in this case.
You probably should start with some unsupervised dimension reduction first, choosing individual variables that stand in pretty well for other variables (as suggested in references noted above) or doing a principal-components analysis on the environmental variables first and using a selection of principal components as the covariates to include in the CCA. (That would be the equivalent of principal-components regression for the regression component of CCA. It would seem that there should be a way to reduce dimension by penalizing covariates similarly to ridge regression or LASSO for this application, but a quick initial search didn't find anything.)
Modifications to CCA
The covariate values can of course be nonlinearly transformed appropriately (e.g., logarithmically) before incorporation into CCA. Chapter 15 of MAED shows that continuous covariates can be modeled by "fuzzy coding" into categorical variables, in a way that can accommodate more complicated non-linear relationships directly. It also seems that it should be possible to incorporate direct modeling of nonlinear relationships, say via restricted cubic splines, in the regression part of CCA; I haven't yet looked into that.
*For simplicity I use CCA as the abbreviation for canonical correspondence analysis here. Note that "CCA" is also used for canonical correlation analysis, a different type of multivariate analysis. To avoid confusion, I would recommend removing the "CCA" tag from this question, or editing the "CCA" tag info on this site to note the potential confusion.
**In a comment to an answer on a related question, I suggested that a multivariate partial least squares (PLS) approach might work for this situation. You might still consider that, but it would not provide any useful way to combine information among species. For a single-species analysis as in that other question there is no way to separate out relationships of environmental variables to species versus sites, so PLS still seems to be a good approach in such cases. Note, however, that single-species analysis is likely to be much less powerful than the multivariate analysis provided by CCA.
***You might have to get into the details of the implementations of CCA to extract the relative lengths and angles corresponding to the covariates. That would be off-topic on this site. Note that R packages provide source code, and there seems to be a mailing list for questions on ecologic analysis in R.