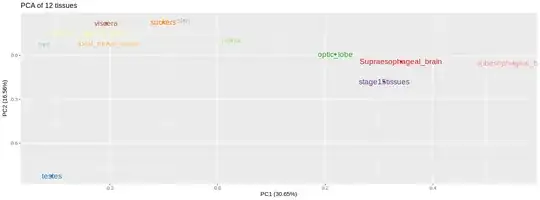
I'm analyzing the expression of a dataset of genes in 12 tissues(the rownames). I constructed a matrix with genes as rows and tissues as columns. I transposed the matrix to observe the PCA of tissues. I would to know the similarity among tissues. can anyone interpret these pca scores?
pca$x
                               PC1         PC2          PC3        PC4         PC5        PC6         PC7         PC8        PC9       PC10
ova                      -94.33510   16.182389   24.4399504 -58.339345    4.875150 -28.908618  25.6659749 -14.2054007 -56.436362 -16.793651
testes                   -90.18614 -177.378225    3.9908015  40.064548    2.181639   7.954307  -4.0899375  -3.0380629   3.031315   1.169147
retina                     7.39437   22.177408   15.4855311 -20.098193   29.324046 113.730363  14.3130541  10.6977148  -5.380255  -2.930546
optic_lobe                64.02055    1.369854   50.5034514 -32.590520   26.378548  -9.078160 -52.2296341 -19.6505681   6.171714  47.686948
subesophageal_brain      160.96257  -11.183784   55.3184079  52.167708  -32.687533 -13.319774  54.1822785  -0.9204015 -14.343083  14.356696
Supraesophageal_brain     99.74678   -9.140050   40.5914715  -5.559214   15.613576 -16.787563 -37.4422182   9.1914754  10.078844 -64.486786
axial_nerve_corde        -59.22247   17.585141   44.8949023 -35.908376   12.447542 -23.555745   0.9355398   2.3417200   4.288873  15.527077
suckers                  -29.57641   48.697031  -50.2427241  72.453724   39.101050 -20.835103 -16.0832215  57.8530926 -22.278607  11.660217
skin                     -18.35160   51.419553  -63.6591345  58.871896   32.202296  -2.237463   6.5965222 -69.1374409  12.025851  -8.929713
stage15tissues            90.55248  -38.593376 -137.6867820 -72.184864  -19.372106  -7.428407   5.8128683   8.0449506   1.052072   5.693779
posterior_salivary_gland -70.47519   31.835133   17.3374690 -20.468310   -3.191976 -19.863079  38.2413639  21.3112057  64.542026  -1.769445
viscera                  -60.52984   47.028927   -0.9733445  21.590946 -106.872232  20.329241 -35.9025905  -2.4882850  -2.752390  -1.183724
                                PC11          PC12
ova                       19.8191933  2.670267e-13
testes                     1.4740740 -6.435220e-13
retina                    -1.1163530  1.386079e-13
optic_lobe                21.0661258 -3.045990e-14
subesophageal_brain       -1.9034947  2.533877e-13
Supraesophageal_brain     -2.5045387  1.709133e-13
axial_nerve_corde        -52.9084858  6.080764e-14
suckers                    3.4646382 -3.608751e-14
skin                      -3.6858974  2.900367e-13
stage15tissues            -4.5598460 -5.765999e-13
posterior_salivary_gland  20.6050331 -1.400667e-14
viscera                    0.2495509  1.529362e-13
I plotted the pca using :
ggplot2::autoplot(pca, label= TRUE, colour= col.pal.paired)
