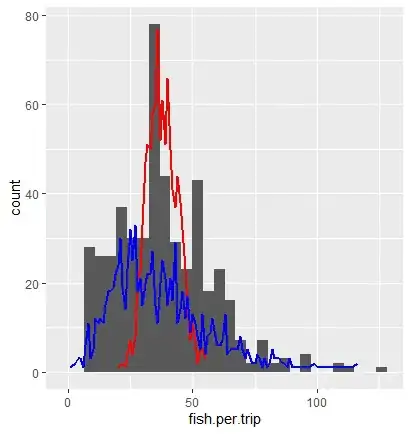
I'm trying to fit some count data for the number of fish purchased by anglers(grey in the image) with a distribution using optim in R. I've fit both a poisson (red) and negative binomial distribution (blue) but as you can see neither seems to be right. What should my next steps be for getting a better fit?
My graph:
#fit poisson curve to data using optim
minus.logL.s<-function(lambda, dat){
  -sum(dpois(dat,lambda, log=TRUE))}

mle<-optim(par=45,fn=minus.logL.s, method="BFGS",hessian=T,dat=survey.responses.baitusers$fish.per.trip)
mle

#simulate data coming from a poisson distribution of mean 38
simspois<-as.data.frame(rpois(1000, 38))
colnames(simspois)<-("simulated_values")

#fit negative binomial curve
minus.logL.nb<-function(pars, dat){
  mu<-pars[1]
  size<-pars[2]
  -sum(dnbinom(dat, mu=mu, size=size,log=TRUE))}

mlenb<-optim(par=c(mu=38,size=1),fn=minus.logL.nb, method="BFGS",hessian=T,dat=survey.responses.baitusers$fish.per.trip)
mlenb

simsnegbin<-as.data.frame(rnbinom(1000,size=4, mu=38))
colnames(simsnegbin)<-("simulated_valuesnb")

#graph both
graph<-ggplot(survey.responses.baitusers)+aes(fish.per.trip)+geom_histogram()+geom_smooth(data=simspois, aes(simulated_values), stat = "count",color="red")+geom_smooth(data=simsnegbin, aes(simulated_valuesnb), stat="count", color="blue")
graph
Output from negative binomial fitting:
$par
       mu      size
38.333338  4.107287
Output from poisson fitting:
$par
[1] 38.33333
My data:
> survey.responses.baitusers$fish.per.trip
  [1]  15  34  42  38   8  38  21  29  58  29  40  35  33  51  50  40   8  45  44  45  34  57   8  28  63  54  22  44  65  54  54  15  12
 [34]  42  59  40  43  95  80  15  54  19  44  27  53  95  21  38  40  13  25  27  79  38  85  40  33  74  34  77  34  34  33  35  89  34
 [67]  34  37  16  60  17  21  18  37  34  27  30  62  48  35  55  50  23  32  56  34  11  21  34  48  15  34  26  54   8  95   8  58  54
[100]  44  34  47  35  13  21  53  52  52  40  40  33   8  15  15  25  41  63  34  38  87  14  68  58  59  34  55  24  24  35  33  21   8
[133]   8  15  51  48   8  21  39  29  50  54  62  16  54  33  58  22  49  40  30  51  21  19  51  40  34  27  40  45  80  69   8  42  33
[166]  62  40  82  17  14  30  61  45  70  33  33  16  49  32  34  31  31  18  64  33  39  21  56  40  52  71  34  30  27  54   8  64  16
[199]  54 127  13  51  40  33  63  31  30  63  56  57  77  46  64  22  34  50  66  33  34  59  45  16  21  60  58  15  64  29  40  44  29
[232]   8  21  16  72  34  49  57  34  34  15  33  54  40  32  33  95 107  49  64  59  64  37  70  45  16  16  40  19  53  34  39  21  36
[265]  34  17   8  34  51  13  20  34  21  38  36  36  41  34  83  27   8  45  29  34  21  37  44  15  50  25  27   8  27  19  24  40   8
[298]  28  36  24  40  21  70  20  34  21  46  16  20   8  33  34  54  44  77  80  15  34  40  29  48  59  29   8  15  47  45  21  41  23
[331]  34  51  14  40  25  45  64  59 107  21  59  27  56  48  34  45  59  35  30  37  32   8  51  11  48  64  32   8  52  14  20  18   8
[364]  53  52  53  33  34  48  62  34  34   8  46  39  21  33  34  40  49  52  19  24  29  43  19  29  27  46  52  29  51  61  16  17  35
[397]  34  40  25  28  34  42  66  35  49  35  51  66  21  51  45  14  53  22  42  64   8  48  28  66  52  40  29  34  34  41  59  34  52
[430]  16  32  20  35   8   8  21  49  40  33  16  24   8  42  23  63  26  21  33   8  23 112  57   8  46  18  67  34  30  33  40  43  57
[463]  60  33  14  27  44  21  31  30  27  49  57  69  66  22  28  55  11  43