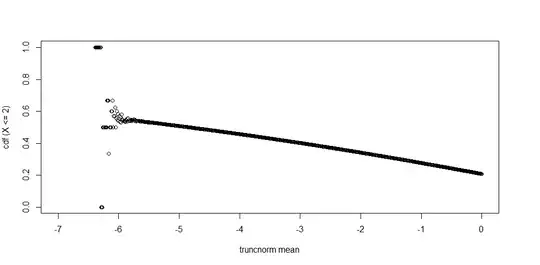
I'm facing some precision issues with truncnorm, particularly the ptruncnorm() function in R. Here's an example where I find the cdf up to $q= 2$, where the truncation point is $1.9$, for several truncated normal distributions that differ only in the means of the distribution.
mean_grid <- seq(-7,0, 0.01)

cdf_list <- c()

for (mean_val in mean_grid) {
  cdf <- ptruncnorm(q = 2, a =1.90, b = Inf, mean = mean_val, sd = 1)
  cdf_list <- c(cdf_list, cdf)
}


plot(x = mean_grid, y = cdf_list, xlab = "truncnorm mean", ylab=  "cdf (X <= 2)")
For mean values (x-axis) at the very left the cdf returns NaN which is reasonable. What I don't understand is that before that, the y-values become haphazard and lose the monotonic pattern in the rest of the graph.
This affects me because I actually want to solve a form: given the truncation point $t$ and a quintile $q$, and an area $c$, solve for a mean $\mu$ such that $\Phi_{t,\mu}(q) = c$, where $\Phi_{t,\mu}$ is the truncated normal cdf. And I use uniroot() to solve this numerically, but if the truncated cdf is not accurate in a region like this then I can't trust the solution.
Does anyone know why this volatility occurs? Am I correct that this is computational precision issue - and if so is there a way to find a more accurate truncated normal cdf?
