0

i conducted a test to see weather smoking have a relationship with pregnancy period or not and the mean and sd were almost the same between smokers and non smokers moms however i got a high p-value i guess because of the high sample size so in a situation like this what should i do ?

here is the inference function i used

inference(y = weeks , x = habit , data = nc , method = "theoretical" ,
 type = "ht" , statistic = "mean" , conf_level = 0.95 , null = 0 ,
 alternative = "twosided" )
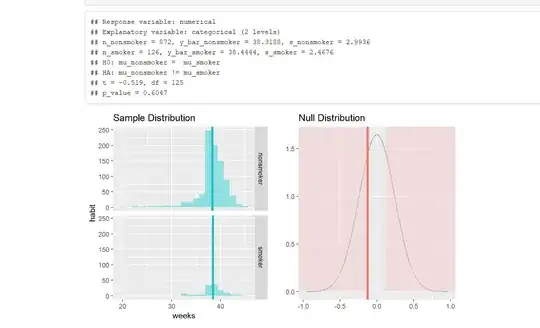
summary statistics and plots for the two groups

  • 1
    If your means and standard deviations are similar between the two groups, you would expect a high p-value. A high p-value is essentially saying that there is a high probability of getting your values or more extreme if the null hypothesis was true. –  Sep 03 '19 at 16:23
  • 1
    @rpolicastro, post as answer? – Ben Bolker Sep 03 '19 at 16:37
  • The phrasing of this question suggests you may be mixing up the interpretation of p-values: large sample sizes tend to produce *small* p-values (for real effects, anyway) and when the means and SDs are about the same, you should expect a *high* p-value. If this sounds confusing, consider reading [more about p-values](https://stats.stackexchange.com/questions/31/what-is-the-meaning-of-p-values-and-t-values-in-statistical-tests). – whuber Sep 03 '19 at 17:14
  • 2
    The question "what should I do" is vague. We don't know what you're trying to do. Also, you should probably brush up on basic statistics. You didn't show which package this came from, but this looks like a t-test that compares the means of two groups. You're comparing the mean pregnancy duration for smokers to non-smokers (i.e. pregnancy duration is your $y$ and $y_bar$). You can see that the mean duration in each group is very similar (e.g. the thick green lines on the two left graphs, or go to the output and use a hand calculator). This will produce a high p-value *regardless of sample size* – Weiwen Ng Sep 03 '19 at 19:43

0 Answers0