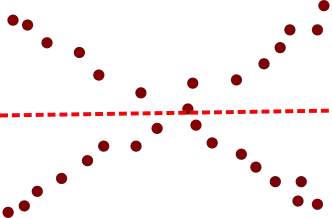
When calculating Information Value and Weight of Evidence, it's possible to draw a chart of WoE for each variable to study its effect on the state of the target variable.
Now, I know it's possible to group values of continuous numeric variables into ranges by grouping those values with similar WoE score in the chart. However, my question is whether it is correct to group together categories of a categorical variable based on the same principle?
In this example, I used the lymphography dataset: https://archive.ics.uci.edu/ml/datasets/Lymphography
I have selected the "pathological" findings and calculated WoE of variable "changes in structure" on it, here is the resulting chart:
Is it alright to group "coarse", "diluted", "drop-like", "faint" and "stripped" into a single category (value)?
