0

I don't know how to interpret these graphs. Is model well fitted? And how to analyze Cook's dist Vs Leverage plot? I would be very grateful for help.

enter image description here

enter image description here

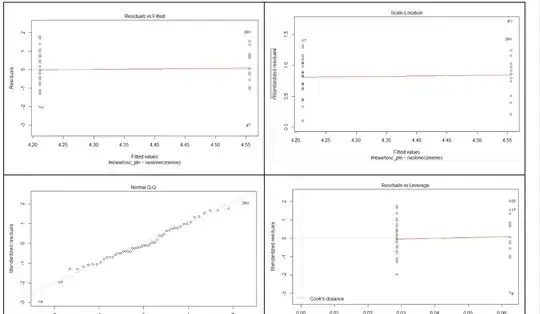
Linear regresssion model shows dependence between drinks’ price=value ( given in $) and information about sunny day (1- it was sunny, 0- it wasn’t sunny).

  • Hello Leks, unfortunately I (we) can not help you. 1. You did not provide a graph. 2. Stackoverflow is not the right website to help you interpret regression results, there exist websites site Stackexchange for that. –  Jun 19 '19 at 06:21
  • I've just added the graphs. I can't find this explicit case in any other sites. –  Jun 19 '19 at 06:24
  • Could you please provide more details about the model you are fitting? It looks like your target variable is discrete. You may want to check https://stats.stackexchange.com/questions/58141/interpreting-plot-lm?rq=1 – David Jun 19 '19 at 07:51

0 Answers0