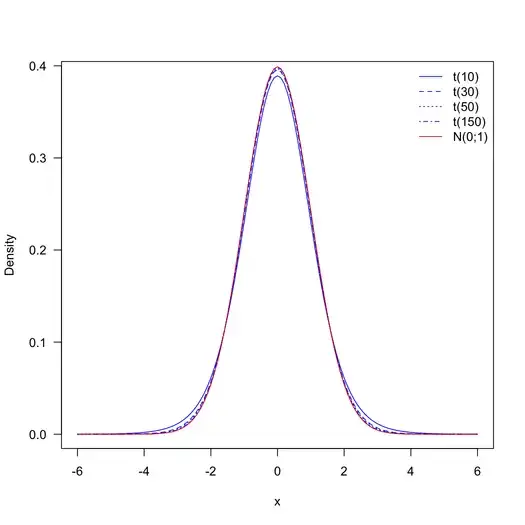
The $t$ distribution tend to the $z$ (gaussian) distribution when $n$ is large (in fact, when $n>30$, they are almost identical, see the picture provided by @onestop). In your case, I would say that $n$ is VERY large, so that you can just use a $z$-test. As a consequence of the sample size, any VERY small differences will be declared significant. So, it is worth asking yourself if these tests (with the full data set) are really interesting.
Just to be sure, as your data set includes 25 variables, you are making 25 tests? If this is the case, you probably need to correct for multiple comparisons so as not to inflate the type I error rate (see related thread on this site).
BTW, the R software would gives you the p-values you are looking for, no need to rely on Tables:
> x1 <- rnorm(n=38704)
> x2 <- rnorm(n=1313662, mean=.1)
> t.test(x1, x2, var.equal=TRUE)

    Two Sample t-test

data:  x1 and x2
t = -17.9156, df = 1352364, p-value < 2.2e-16
alternative hypothesis: true difference in means is not equal to 0
95 percent confidence interval:
 -0.1024183 -0.0822190
sample estimates:
  mean of x   mean of y
0.007137404 0.099456039