I have data grouped into category A and category B.
My hypothesis: the data in category A is closer to zero than category B.
What statistical tests can be used?
Thanks
I have data grouped into category A and category B.
My hypothesis: the data in category A is closer to zero than category B.
What statistical tests can be used?
Thanks
Sounds as if you don't care whether an angle is positive or negative--only how far it is from zero. So you'd want to take the absolute value of each angle before conducting your test. And the natural candidates for that would be a T-test if you have large amounts of data (implying the sampling distributions of the mean absolute values would be approximately normal) and the Mann-Whitney U if you don't. (@Stephane's suggestion of ANOVA amounts to a T-test when you have only 2 groups.)
This R code illustrates the Mann-Whitney procedure.
# Create some data.
set.seed(17)
males <- rnorm(32)
females <- rnorm(32) * 3/2

# The Wilcoxon/Mann-Whitney test on absolute values.
wilcox.test(abs(males), abs(females))
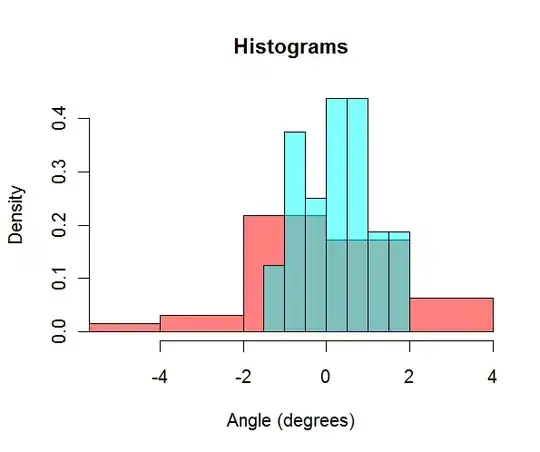
The result in this case is a Wilcoxon statistic of 358 for two groups of 32 observations, giving a p-value of 0.0387: because it is less than a conventional threshold of 0.05, it can be taken as some evidence that the female deviations are greater than the male deviations. To get a better picture of these data, let's look at histograms (red=female, cyan=male):
maleHist <- hist(males, freq=FALSE)
femaleHist <- hist(females, freq=FALSE)
xMin <- min(males, females)
xMax <- max(males, females)
yMax <- max(maleHist$intensities, femaleHist$intensities)
plot(femaleHist, freq=FALSE, xlim=c(xMin, xMax), ylim=c(0, yMax), col=hsv(1, alpha=0.5), main="Histograms", xlab="Angle (degrees)")
lines(maleHist, freq=FALSE, col=hsv(.5, alpha=0.5))

Evidently, about 32 values in each group are needed to distinguish these sets of deviations, one of which is about 50% greater in size than the other: your power to tell that one group of deviations is closer to zero than the other is not very good.