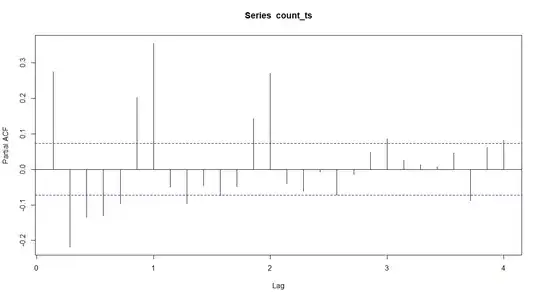
My data gave me following ACF and PACF plots. How should I interpret them?
Asked
Active
Viewed 66 times
0
-
there are a lot of posts regarding interpreting acf and pacf plots on this site already. Your question runs a very very high risk of getting closed as duplicate. Please search this site, i am sue you will get relevant answers. – naive May 07 '19 at 09:56
-
Weekly data is often affected by holiday events . The acf and pacf of the original data is often insufficient to identify a good model. Only the data knows for sure. If you post it (include starting date and country if applicable) I will try and help see https://stats.stackexchange.com/questions/406986/sarima-modelling-results-choosing-the-right-lag-for-seasonal-data for a very similar (but different) question. – IrishStat May 07 '19 at 10:09
-
@IrishStat thanks for your response. Starting date of the data is 07 dec 2016 and country is US. – vikas chowdary May 07 '19 at 11:32
-
and the original data is where ? – IrishStat May 07 '19 at 11:38

