I help a colleague to bootstrap a meta-analysis mixed-effects model using the metafor R package framework authored by @Wolfgang.
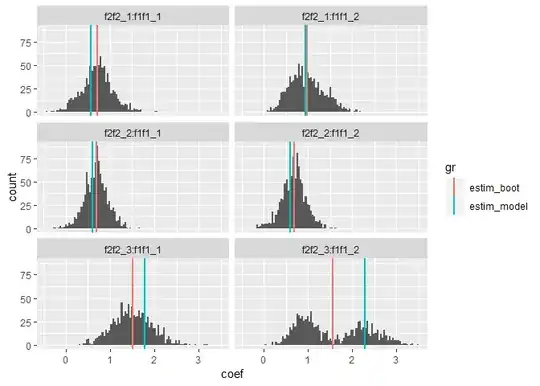
Interestingly and worryingly, for one of the model's coefficients I get a bimodal distribution when bootstrapping (see the bottom-right panel of the figure below).
I guess one of the main causes could be the fact that when bootstrapping, say half of the models converge in a local solution and the other half in another one. I tried to tune the convergence algorithm as suggested in this metafor documentation - Convergence Problems with the rma() function. Also, I tried other convergence algorithms like bobyqa and newuoa as suggested in the help documentation of rma.mv function, but got the same bimodal response.
I also tried to eliminate some of the potential outliers from the problematic group as suggested in How to interpret multimodal distribution of bootstrapped correlation, but to no avail.
I couldn't find a way to reproduce this so I uploaded data on a GitHub repository (also the links in the code section below should load in your environment all that is needed to test the case). I run the bootstrapping on a Linux cluster as an array job (just in case, the shell script is job.sh, which executes on each CPU the R script bootstrap.r that runs the model described below). A single run takes 2-3 minutes. Note that bootstrapping 100 times is also enough to detect the bimodal response. Below is an example for 1000 iterations. I am familiar with R and other methods but not that much with meta-analysis.
I would appreciate help with understanding if the bimodal distribution is ok (though might be due to convergence issues) and if not, then what can one do about it? (besides what I tried already)
Below - comparing coefficients from bootstrapping (red lines) and from a single full model run (blue lines). The histograms depict the bootstrapped distributions for each coefficient. Sampling the data for bootstrapping was done as selecting with replacement from each group/combination formed by the two fixed effects. Their raw sample sizes are:
table(dt$f1, dt$f2)
#>
#>        f2_1 f2_2 f2_3
#>   f1_1  177  174   41
#>   f1_2  359  363  107
library(data.table)
library(ggplot2)
library(metafor)
#> Loading required package: Matrix
#> Loading 'metafor' package (version 2.0-0). For an overview
#> and introduction to the package please type: help(metafor).

load(url("https://github.com/valentinitnelav/test/raw/master/bimodal_distrib_boot/coef_boot_dt_1010.rda"))
load(url("https://github.com/valentinitnelav/test/raw/master/bimodal_distrib_boot/rmamv_model.rda"))
load(url("https://github.com/valentinitnelav/test/raw/master/bimodal_distrib_boot/data.rda"))

coef_dt <- data.frame(estim = rmamv_model[["beta"]])
coef_dt$coef_name <- rownames(coef_dt)
coef_dt <- rbind(coef_dt,
                 coef_boot_dt[, .(estim = mean(coef)), by = coef_name])
coef_dt[, gr := rep(c("estim_model", "estim_boot"), each = 6)]

ggplot(data = coef_boot_dt,
       aes(x = coef,
           group = coef_name)) +
  geom_histogram(bins = 100) +
  geom_vline(aes(xintercept = estim,
                 group = gr,
                 color = gr),
             lwd = 1,
             data = coef_dt) +
  facet_wrap(vars(coef_name), ncol = 2)
Created on 2019-05-02 by the reprex package (v0.2.1)
The model goes like this:
rmamv_model <- rma.mv(y ~ f2:f1 - 1,
                  V = var_y,
                  random = list(~ 1|r1,
                                ~ 1|r2),
                  R = list(r2 = cor_mat),
                  data = dt,
                  method = "REML",
                  # Tune the convergence algorithm / optimizer
                  control = list(optimizer = "nlminb",
                                 iter.max = 1000,
                                 step.min = 0.4,
                                 step.max = 0.5))
R session info:
devtools::session_info()
#> - Session info ----------------------------------------------------------
#>  setting  value
#>  version  R version 3.5.2 (2018-12-20)
#>  os       Windows 7 x64 SP 1
#>  system   x86_64, mingw32
#>  ui       RTerm
#>  language (EN)
#>  collate  English_United States.1252
#>  ctype    English_United States.1252
#>  date     2019-05-02
#>
#> - Packages --------------------------------------------------------------
#>  package     * version date       lib source
#>  assertthat    0.2.1   2019-03-21 [1] CRAN (R 3.5.2)
#>  backports     1.1.3   2018-12-14 [1] CRAN (R 3.5.2)
#>  callr         3.2.0   2019-03-15 [1] CRAN (R 3.5.3)
#>  cli           1.1.0   2019-03-19 [1] CRAN (R 3.5.3)
#>  colorspace    1.4-1   2019-03-18 [1] CRAN (R 3.5.3)
#>  crayon        1.3.4   2017-09-16 [1] CRAN (R 3.5.1)
#>  curl          3.3     2019-01-10 [1] CRAN (R 3.5.2)
#>  data.table  * 1.12.0  2019-01-13 [1] CRAN (R 3.5.2)
#>  desc          1.2.0   2018-05-01 [1] CRAN (R 3.5.1)
#>  devtools      2.0.1   2018-10-26 [1] CRAN (R 3.5.1)
#>  digest        0.6.18  2018-10-10 [1] CRAN (R 3.5.1)
#>  dplyr         0.8.0.1 2019-02-15 [1] CRAN (R 3.5.2)
#>  evaluate      0.13    2019-02-12 [1] CRAN (R 3.5.2)
#>  fs            1.2.7   2019-03-19 [1] CRAN (R 3.5.3)
#>  ggplot2     * 3.1.0   2018-10-25 [1] CRAN (R 3.5.1)
#>  glue          1.3.1   2019-03-12 [1] CRAN (R 3.5.2)
#>  gtable        0.2.0   2016-02-26 [1] CRAN (R 3.5.1)
#>  highr         0.8     2019-03-20 [1] CRAN (R 3.5.3)
#>  htmltools     0.3.6   2017-04-28 [1] CRAN (R 3.5.1)
#>  httr          1.4.0   2018-12-11 [1] CRAN (R 3.5.2)
#>  knitr         1.22    2019-03-08 [1] CRAN (R 3.5.2)
#>  labeling      0.3     2014-08-23 [1] CRAN (R 3.5.0)
#>  lattice       0.20-38 2018-11-04 [2] CRAN (R 3.5.2)
#>  lazyeval      0.2.2   2019-03-15 [1] CRAN (R 3.5.3)
#>  magrittr      1.5     2014-11-22 [1] CRAN (R 3.5.1)
#>  Matrix      * 1.2-15  2018-11-01 [2] CRAN (R 3.5.2)
#>  memoise       1.1.0   2017-04-21 [1] CRAN (R 3.5.1)
#>  metafor     * 2.0-0   2017-06-22 [1] CRAN (R 3.5.2)
#>  mime          0.6     2018-10-05 [1] CRAN (R 3.5.1)
#>  munsell       0.5.0   2018-06-12 [1] CRAN (R 3.5.1)
#>  nlme          3.1-137 2018-04-07 [2] CRAN (R 3.5.2)
#>  pillar        1.3.1   2018-12-15 [1] CRAN (R 3.5.2)
#>  pkgbuild      1.0.3   2019-03-20 [1] CRAN (R 3.5.3)
#>  pkgconfig     2.0.2   2018-08-16 [1] CRAN (R 3.5.1)
#>  pkgload       1.0.2   2018-10-29 [1] CRAN (R 3.5.1)
#>  plyr          1.8.4   2016-06-08 [1] CRAN (R 3.5.1)
#>  prettyunits   1.0.2   2015-07-13 [1] CRAN (R 3.5.1)
#>  processx      3.3.0   2019-03-10 [1] CRAN (R 3.5.3)
#>  ps            1.3.0   2018-12-21 [1] CRAN (R 3.5.2)
#>  purrr         0.3.2   2019-03-15 [1] CRAN (R 3.5.3)
#>  R6            2.4.0   2019-02-14 [1] CRAN (R 3.5.2)
#>  Rcpp          1.0.1   2019-03-17 [1] CRAN (R 3.5.3)
#>  remotes       2.0.2   2018-10-30 [1] CRAN (R 3.5.1)
#>  rlang         0.3.4   2019-04-07 [1] CRAN (R 3.5.3)
#>  rmarkdown     1.12    2019-03-14 [1] CRAN (R 3.5.3)
#>  rprojroot     1.3-2   2018-01-03 [1] CRAN (R 3.5.1)
#>  scales        1.0.0   2018-08-09 [1] CRAN (R 3.5.1)
#>  sessioninfo   1.1.1   2018-11-05 [1] CRAN (R 3.5.1)
#>  stringi       1.4.3   2019-03-12 [1] CRAN (R 3.5.2)
#>  stringr       1.4.0   2019-02-10 [1] CRAN (R 3.5.1)
#>  tibble        2.1.1   2019-03-16 [1] CRAN (R 3.5.3)
#>  tidyselect    0.2.5   2018-10-11 [1] CRAN (R 3.5.1)
#>  usethis       1.4.0   2018-08-14 [1] CRAN (R 3.5.1)
#>  withr         2.1.2   2018-03-15 [1] CRAN (R 3.5.1)
#>  xfun          0.5     2019-02-20 [1] CRAN (R 3.5.2)
#>  xml2          1.2.0   2018-01-24 [1] CRAN (R 3.5.1)
#>  yaml          2.2.0   2018-07-25 [1] CRAN (R 3.5.1)