2

According to the auto-correlation method, my time-series is white noise (i.e. 95% of ACF within ±2/√T), yet the data are counts and thus the mean >0.

Are these two facts incompatible?

I'm using the fpp package in R. Here are my data:

library(dplyr)
library(fpp)

rawdata <- c(414,334,439,385,341,338,365,330,403,321,352,339,270,410,372,332,368,377,392,452,410,411,332,329,422,373,457,406,395,510,412,395,472,429,436,342,427,358,372,393,465,422,481,396,374,393,375,366,313,384,294,311)

#and the plot code:

rawdata%>% ts(frequency=13) %>%
ggAcf()
  • 2
    To help others answer your question, it's helpful to list the minimal set of packages needed to use the code in your example (I think that's `dplyr`, `ts`, and `forecast`). – bschneidr Apr 29 '19 at 14:46
  • 1
    I agree with Oliver. I think though that the answer you'll ultimately get is that the two facts you mention aren't incompatible, if I understand your question correctly. The mean of the time series is non-zero, but deviations around the mean are zero on average. – bschneidr Apr 29 '19 at 15:16
  • 1
    ben, aren't the average of deviations around the mean always 0? –  Apr 29 '19 at 15:19
  • sorry dont know where i got ben from, bschneider i mean! – deethreenovice Apr 29 '19 at 15:39
  • what is the frequency of your 52 observations ? – IrishStat Apr 29 '19 at 15:51
  • That's my actual name, so no worries. But yeah, I didn't phrase that right. What I should have said is that a series being white noise doesn't mean that the mean of the series has to be zero. It just means that there's no systematic kind of trend or correlations in deviations about the mean of the series. For example, if every observation were a draw from `Norm(mu = 375, sd = 50)` that would be white noise, even though the mean is 375. – bschneidr Apr 29 '19 at 15:52
  • ok i got it it is 13 – IrishStat Apr 29 '19 at 15:52

3 Answers3

3

It's almost pointless to talk about white noise in relation to such short time series. Think of this: you have to establish spectral uniformity of the series. The fidelity and bandwidth of spectral decomposition is so low that you can't reliably claim much on this series in terms of whiteness of the noise, in my opinion.

On the second point, the mean being not zero, the answer could be YES to a reformulated question: can the noise in my series be white if the mean of the series is greater than zero? If you have series $x_t=c+\varepsilon_t$, where $c >0$ is a constant, then $E[x_t]>0$ even when $\varepsilon_t$ is white noise. If you remove the bias in your series, and they become zero mean and colorless, thwn why not call them white noise with bias?

Aksakal
  • 55,939
  • 5
  • 90
  • 176
1

Your question might have been entitled in the reverse "is there a useful model for my data or is it without significant predictable structure other than the mean "

The distribution of the observed series IS OF NO CONCERN . The distribution of the residuals from a useful model IS OF CONCERN as that is where all the assumptions reside (are placed !).

Your original data is far from white noise with an Actual/Fit and Forecast graph hereenter image description here showing strong/systematic impact for a few periods of the year and a very significant seasonal auto-regressive structure and a significant level shift down at period 43(44) (FOLLOW THE BLUE LINE IN THE FORECAST REGION ) .

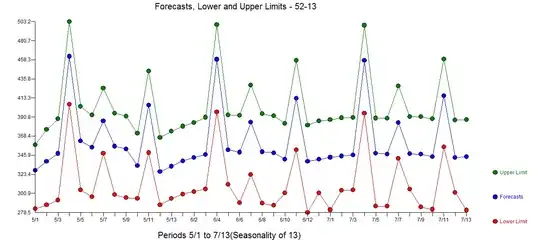
The forecasts are a working image of the model ... enter image description here

The model is here enter image description here and in more detail here enter image description here

The residuals from the model enter image description here have the following ACF enter image description here suggesting "whiteness" i.e. no anomalies , no auto-correlation in the residuals.

Finally the Actuals/cleansed plot is informative as to the latent identified deterministic structure enter image description here

Finally your statement about the acf of the original series suggesting "whiteness" is due to the downwards bias introduced by not treating the pulses and the level shift. See Detecting outliers in a time-series for more on this. Additionally models need to detect anomalies since if untreated they inflate the variance of the errors causing incorrect acceptance of the hypothesis of randomness. Prof. J.K.Ord has referred to this as "the Alice in wonderland effect". The problem is that you can't catch an outlier without a model (at least a mild one) for your data. Else how would you know that a point violated that model? In fact, the process of growing understanding and finding and examining outliers must be iterative. This isn't a new thought. Bacon, writing in Novum Organum about 400 years ago said: "Errors of Nature, Sports and Monsters correct the understanding in regard to ordinary things, and reveal general forms. For whoever knows the ways of Nature will more easily notice her deviations; and, on the other hand, whoever knows her deviations will more accurately describe her ways."

IrishStat
  • 27,906
  • 5
  • 29
  • 55
  • Hello IrishStat. Thank you for your response. You're right, that would be a better title for my question; I wanted to show that I had attempted to do something rather than just asking someone to model my data. Which model have you fit please? I have very limited knowledge but it looks like ARIMA; I am using R. – deethreenovice Apr 30 '19 at 09:06
  • If you like my answer ( and I am sure that you do !) .. upvote it and accept it .. glad 2 be of help ... It gave me an opportunity to get on my soapbox ... so to speak .. – IrishStat Apr 30 '19 at 09:09
  • I think you have the actuals and fit labels the wrong way around. Happy to upvote, although I don't really understand the modelling output. – deethreenovice Apr 30 '19 at 15:55
  • I have looked closely and I think they are correctly labelled. If you wish u can skype me and we can look at this together. If you wish you can call me and I will walk/talk you through the modelling output. – IrishStat Apr 30 '19 at 19:26
  • The fit series is bright green and the first value is 414, which is the first value in my data. Also, I'm assuming the fit should start after the actuals if you're using an interpolated average as part of the model? – deethreenovice May 01 '19 at 10:10
  • the fit and the actual are the SAME for the first 14 because the model uses a lag of 14 ...thus we have 14 zero residuals followed by estimated residuals . – IrishStat May 01 '19 at 12:42
1

White noise is defined as intendent with mean equal to zero, so with non-zero mean it is obviously inconsistent with the definition. Time-series can be uncorrelated and have any mean, lack of correlation does not imply anything about the mean.

Tim
  • 108,699
  • 20
  • 212
  • 390