3

I asked earlier what is the idea behind putting up Table 3.

I have a follow up question on how non-response bias identified can justify the different sizes of Confidence Interval(CI) in Figure 3. My reasoning is that assuming p-value are small for the exercises, this adds some systematic error into the formation of CI size, and accounts for the varying size of CI in the research(Figure 3)? Also, only remaining follow-up data is analysed as the sample size for each exercise, larger analysed samples would generally mean smaller random errors. The systematic and random errors will account for the differing sizes of CI for all exercises.

Here's an online copy of the research article.
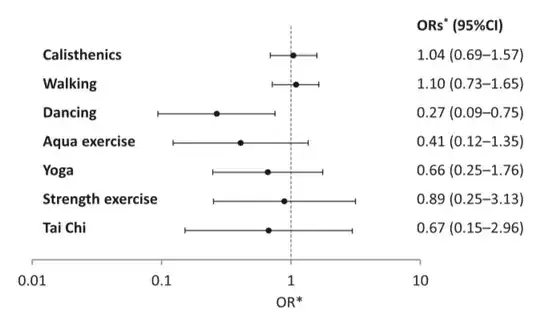
Figure 3

1 Answers1

5

Quantifying non-response bias is a very difficult statistical exercise. You are absolutely right that it should affect the reported figures... but the standard software won't do it, so there is where most people stop and give up. Some responsible practices include:

  1. Creating and utilizing nonresponse adjusted weights, and utilizing them in your standard procedures -- this would affect both point estimates (hopefully bringing them closer to the population values) and standard errors (typically increase them, to reflect the fact that nonresponse increases our uncertainty about the answer).
  2. Estimating the bias explicitly as a statistical quantity -- this is usually difficult as it requires (a) thinking through the nonresponse process, as in, "why do people not respond", and figuring out how that qualitative process can be quantified, (b) setting up a statistical procedure around that thinking, (c) getting standard errors that are not outright dubious (see e.g. Witt 2010).
  3. Discussing MSE rather than variance, i.e., incorporating the error due to bias into your measure of uncertainty regarding the point estimate, rather than trying to adjust the estimate itself. One can arguably say that this is more in line with the total survey error framework (Groves and Lyberg 2010, see especially Figure 3).

You need a real survey statistician on your team to entertain / implement any of these. Let's just say though that survey statisticians are in a demand that outstrips the supply by a factor of probably 5, so you are likely out of your luck.

StasK
  • 29,235
  • 2
  • 80
  • 165