0

I came across this in a research article, and I wondered what the p-value is showing here and what does the sentence even mean? Can someone explain what is the null hypothesis relating to the p-value?

"Participants who were involved in some exercise were more likely to participate in the follow‐up survey (see Table 3)."

Here's an online copy of the research article.

Table

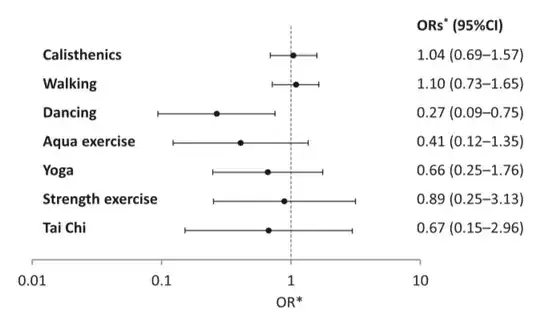
Update: How does the non-response bias affect the Confidence Interval(CI) around the Odds Ratio of getting ADL disability from exercise participation?

Figure 3

1 Answers1

0

Researchers in this article conducted a baseline survey of participants in these seven exercise programs and then tried to conduct a follow-up survey of the same participants eight years later. They were able to obtain follow-up survey responses from 1,019 participants and were unable to obtain follow-up responses from 910 participants.

This table shows how many (both in count form and percentage form) of these two groups of individuals (1,019 and 910) participated in each of the exercise programs. Then, the researchers conducted seven chi-square tests for independence between two categorical variables (whether someone responded to follow-up survey and whether someone participated in the given exercise program). The null hypothesis in those chi-square tests is that the two variables are independent, meaning that whether someone participated in a particular exercise program is independent of whether they responded to the follow-up survey. Small p-values indicate that there is in fact a dependence between the two variables.

The sentence you provided above the table does not appear to be worded correctly. Instead of saying "participants who were involved in some exercise were more likely to participate in the follow‐up survey", they should have said "individuals who participated in the follow-up survey were more likely to be involved in some exercise".
AlexK
  • 1,007
  • 4
  • 11
  • May I ask in the given table, how would you judge the non-response bias for each exercise? I want to address the differences in the size of CI, and I think the random errors and non-response bias have a part to play for this. – Prashin Jeevaganth Apr 04 '19 at 04:55
  • Non-response to what? Follow-up survey? By non-response bias do you mean whether participants in some exercise programs were more likely to respond/not respond to follow-up survey? Well, these low p-values tell you that this was true for some of the exercise groups. – AlexK Apr 04 '19 at 05:14
  • Hmm, yea the likeliness to respond to the follow-up survey. Is it arguable that if p-value are small for the exercises, this adds some systematic error into the formation of CI size, and accounts for the varying size of CI in the research(Figure 3)? – Prashin Jeevaganth Apr 04 '19 at 05:25
  • I don't know what CI size you are referring to. I won't read the paper. – AlexK Apr 04 '19 at 05:41
  • CI refers to the confidence interval for the odds ratio of getting disability from exercises. – Prashin Jeevaganth Apr 04 '19 at 05:50
  • You should ask a separate question if you need more information. I responded to your original question. – AlexK Apr 04 '19 at 06:00
  • Noted that, thanks for your help in this question. If you won't mind, could you have a look at another of my [question](https://stats.stackexchange.com/questions/401117/how-does-non-response-bias-affect-the-confidence-interval) – Prashin Jeevaganth Apr 04 '19 at 06:15
  • This is not a straightforward question with an easy answer. If you look up the formula for confidence interval of an odds ratio, you'll see that it's not just a simple function of one or two values. The math is more involved, plus in your case you also have a third factor - getting disability, in addition to response rates calculated from group counts and exercise participation counts. – AlexK Apr 04 '19 at 06:52