6

I am trying to fit a time series model for household data which is a time series variable. Initially my data looks like this, enter image description here
Since the data does not seem to be stationary I differenced the data.

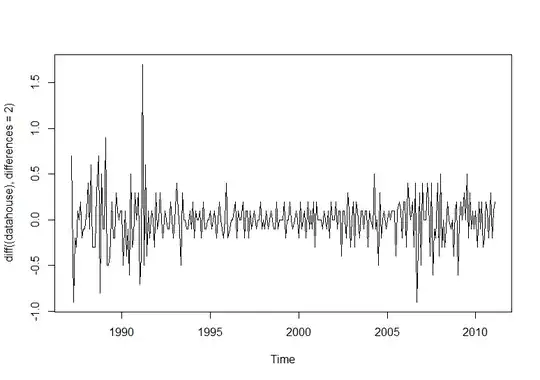
When I plot the 2nd difference data, it looks like follows:

enter image description here

The plots didn't improve when I took a higher order difference. So I used the 2nd difference data.

The acf and pacf of the 2nd order data are as follows,

enter image description here

To estimate the coefficients I used the yule walker method and following results obtained,

enter image description here

Then I tried the different combinations of models with 2 coefficients. I fitted ARIMA models for original data by considering the parameter for difference as 2(D=2). Using the AIC criteria, I got ARIMA (1,2,1) as the best model.

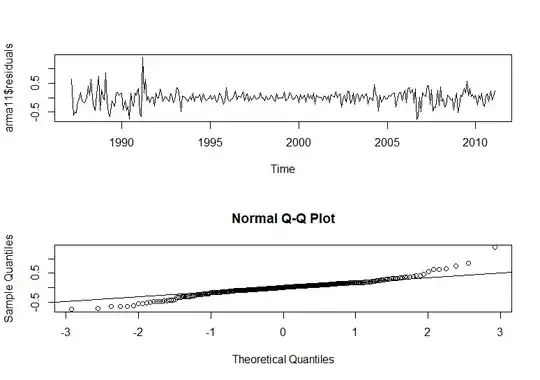
The model diagnostics results of this model as follows,

enter image description here

enter image description here

When considering the plots, it seems that the results are reasonable except the normality of residuals.

Can anyone suggest a way of improving this results? I am kind of new to time series so your advice will be a huge help for me.

The data set for this problem is follows, I need to fit a model for the variable x4

Data set: https://drive.google.com/file/d/1CXokm4p5ED2I03o0qGyWdxex38P-157M/view
einar
  • 3,258
  • 2
  • 19
  • 31
student_R123
  • 751
  • 4
  • 13
  • I’m not entirely sure what your question is here. But why did you choose to take the second difference rather than the first? – The Laconic Mar 05 '19 at 03:03
  • @TheLaconic Initally I took the first difference . But the results were not satisfactory. Then the results were improved after taking the 2nd difference. You will see the plot that based on the 2nd difference. My question is about how to improve this model further . Because you will see that residuals are not normally distributed. – student_R123 Mar 05 '19 at 04:03
  • @TheLaconic Do you think that i can improve this model ? – student_R123 Mar 05 '19 at 14:08
  • 1
    Post your data and I will try and help – IrishStat Mar 07 '19 at 01:21
  • @IrishStat Thank you very much. I added a link for the data in my question. – student_R123 Mar 08 '19 at 02:58

1 Answers1

2

You politely asked "My question is about how to improve this model further . Because you will see that residuals are not normally distribute" . I have answered .....

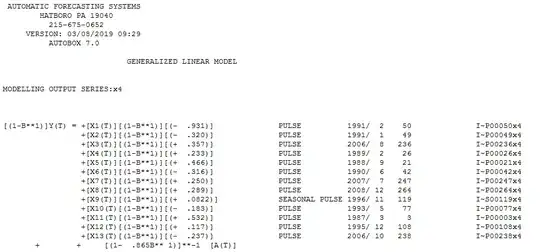
I took your 290 monthly values (1987/1) and introduced them to AUTOBOX which automatically identified the following model.

1) ARIMA (1,1,0)(0,0,0)12 WITH AR COEFFICIENT=.865 THUS THIS IS VERY CLOSE TO SECOND DIFFERENCES WHICH YOU HAD CONSIDERED

2) 1 SEASONAL PULSE (POSITIVE) STARTING IN NOVEMBER 1996

3) 12 UNUSUAL VALUES (PULSES)

4) TWO MODEL ERROR VARIANCE CHANGES A) DOWNWARDS AT PERIOD 60 (1991/12) AND UPWARDS AT PERIOD 174 (2001/6) ... BOTH VISUALLY OBVIOUS FROM YOUR GRAPHS

This is the model enter image description here

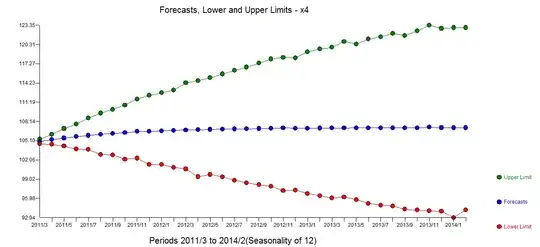
The Actual,Fit and Forecast is here enter image description here with forecasts (and 95$ monte carlo based) hereenter image description here

The procedure following Tsay https://pdfs.semanticscholar.org/09c4/ba8dd3cc88289caf18d71e8985bdd11ad21c.pdf to identify variance change points yielded enter image description here

The model residuals are here enter image description here

The reasons that your software's attempt to model this data failed is that the original data is compromized by complications or opportunities.

IrishStat
  • 27,906
  • 5
  • 29
  • 55