I have time-series data for stock price. A sample of dataset is given below:
DATE    STOCK_PRICE
1/7/2012    26
1/8/2012    31
1/9/2012    28
1/10/2012   38
1/11/2012   36
1/12/2012   20
1/13/2012   23
1/14/2012   23
1/15/2012   1.1
1/16/2012   1.4
1/17/2012   1.9
1/18/2012   2.3
1/19/2012   5.8
1/20/2012   39
1/21/2012   20
1/22/2012   25
1/23/2012   31
1/24/2012   40
1/25/2012   29
1/26/2012   20
1/27/2012   24
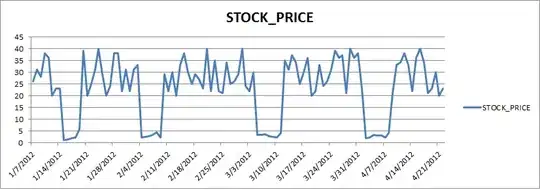 Now, I'm trying to get UCM (using PROC UCM), such that it fully captures the pattern of the series. PROC UCM in SAS breaks the series into LEVEL, SEASON & CYCLE, then tries to predict the series based on these 3 factors. From the data & graph you can see at some point the data pattern breaks down completely. So UCM can't able to capture the sudden drop in this series. I can use DUMMY variables to do that. But don't want to use it as it is very difficult to explain the nature of dummies.
Can anybody can help me to find how I can predict the series using LEVEL, SEASONAL & CYCLE (or some other parameters)? I'm using PROC UCM to get it, but some R equivalent would also be helpful. If there are other methods to capture this pattern, those would be helpful as well.