How would I go about forecasting future population with a growth function in R?
I'm trying to fit a growth function to the sales of EVs in the world. One assumption I might want to make would be one such as max potential sales would be 110 million. Current vehicle sales in the world are 96,804,38 with 3,109,050 being EVs in 2017. This is for both BEV and PHEV.
The source I've used are:
Logistic substitution model and technological forecasting by Dmitry Kucharavy and Roland De Guio
 Application of S-shaped curves by Dmitry Kucharavy and Roland De Guio

Data is from the iea EV outlook.
 EVAnnualWorldSales<-structure(list(Country = structure(c(21L, 21L, 21L, 21L, 21L,
 21L, 21L, 21L, 21L, 21L, 21L, 21L, 21L), .Label = c("Australia",
 "Brazil", "Canada", "Chile", "China", "Finland", "France", "Germany",
 "India", "Japan", "Korea", "Mexico", "Netherlands", "New Zealand",
 "Norway", "Others", "Portugal", "South Africa", "Sweden", "Thailand",
 "Total", "United Kingdom", "United States"), class = "factor"),
Year = c(2005, 2006, 2007, 2008, 2009, 2010, 2011, 2012,
2013, 2014, 2015, 2016, 2017), TotalSales = c(1.89, 2.23,
2.69, 5.15, 7.48, 14.26, 61.33, 179.03, 381.3, 703.65, 1239.45,
1982.04, 3109.05)), row.names = c(NA, -13L), .Names = c("Country",
 "Year", "TotalSales"), class = "data.frame")
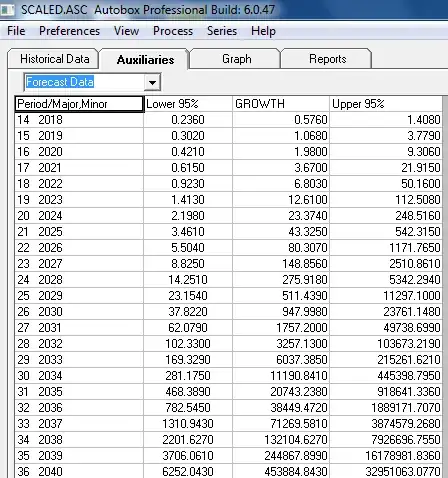
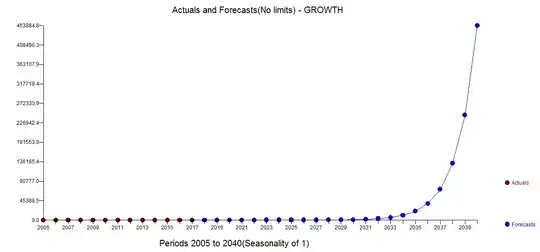
How would I go about forecasting EV sales through 2040?
Here is what I've tried:
myfunction <- function(GrowthRate, time, Beta){
    AsymptoticLimitOfGrowth =88000
    Value = AsymptoticLimitOfGrowth / (1+exp(-GrowthRate*time-Beta))
    return(Value)
 }
nls(TotalSales ~ myfunction(GrowthRate, time, Beta),
 data=EVAnnualWorldSales,
start=list(GrowthRate=0.5, time=2030, Beta=1))
with error:
 Error in qr(.swts * gr) :
 dims [product 3] do not match the length of object [13]
 In addition: Warning message:
 In .swts * gr :
  longer object length is not a multiple of shorter object length
and
EV.ss <- nlsLM(TotalSales ~ SSgompertz(Year, Asym, b2, b3), data = EVAnnualWorldSales)
Error: Error in qr.qty(QR.rhs, .swts * ddot(attr(rhs, "gradient"), lin)) : NA/NaN/Inf in foreign function call (arg 5)
and
 EV.ss <- nls(TotalSales ~ SSlogis(Year, phi1, phi2, phi3), data = EVAnnualWorldSales)
 summary(EV.ss)
The last one generates an output but the limit if far below what would be expected. Therefore, not a logical result.
Would someone be able to point me in the correct direction?


