1

I am trying to determine the distribution of my data to carry out a glmer. Indeed, I need to write the term 'family = X' in the command of the glmer but I am not able to find the distribution.

Model is of this type:

mod4<-glmer(Correct_TL~Temperature*Population + Size + (1|Measurement), data=df, family=X)

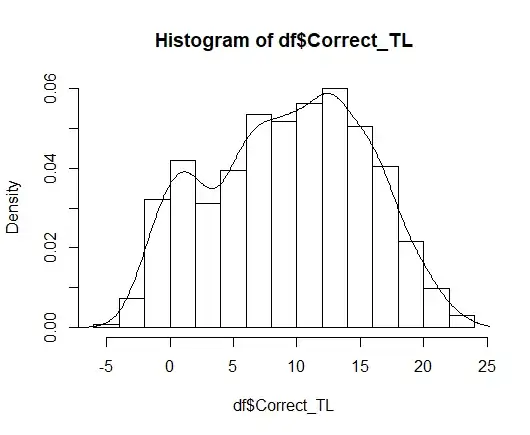
The response variable 'Correct_TL' contains negative values as it corresponds to the difference between total length of each individual and the mean of its group.

I plotted the data as follows and got this graph:

hist(df$Correct_TL, freq=FALSE)
lines(density(df$Correct_TL))

Histogramme of my data

Then, I run the following command (I read some discussions):

library(fitdistrplus)
descdist(df$Correct_TL, discrete = FALSE)
normal_dist <- fitdist(df$Correct_TL, "norm")
plot(normal_dist)

And got this:

Cullen and Frey graph

Figures

I am really not familiar with this. But looking at the graphs, I would say data could be considered as normal. What do you think ? Do you have any idea of what else it could be ? I tried to do the same for gamma and lognormal distributions but as I have negative values, it does not work.

Roland
  • 5,758
  • 1
  • 28
  • 60
Marine
  • 11
  • 1
  • Please register &/or merge your accounts (you can find information on how to do this in the **My Account** section of our [help]), then you will be able to edit & comment on your own question. – gung - Reinstate Monica Jul 26 '18 at 11:20

1 Answers1

3

From your description of your data I don't see any reason to not expect a Gaussian family to be appropriate (which means you should use lmer). You'd typically check the distribution of residuals after fitting the model (the residuals should be symmetric around zero and homoskedastic and yes, preferably somewhat close to normal distributed). The distribution of your dependent variable is not relevant because you expect it to depend on other variables which means it shouldn't be a normal distribution.

There are situations where you expect to need a GLMM. Typical examples are modelling of count or abundance data, fractions, ratios or proportion data. Your example seems like a classical example (such as human body height) where a Gaussian linear model is appropriate.

Roland
  • 5,758
  • 1
  • 28
  • 60
  • Thank you for your answer. The thing is that at the beginning I rejected the normal distribution before doing this test as I did first a shapiro test that 'said' (at least, that is what I thought) that the distribution of my data was not normal. Resuts of the shapiro test: Shapiro-Wilk normality test data: df$Correct_TL W = 0.9807, p-value < 2.2e-16 – Marine Banse Jul 26 '18 at 09:56
  • Please don't post answers that don't actually answer the question. I can only repeat, the distribution of your data is not relevant. The distribution of the residuals is important. – Roland Jul 26 '18 at 10:13
  • Please register &/or merge your accounts (you can find information on how to do this in the **My Account** section of our [help]), then you will be able to edit & comment on your own question. – gung - Reinstate Monica Jul 26 '18 at 11:20
  • Roland, do you suggest me to do a lmer then ? And to 'ignore' the results of the shapiro.test ? I am not really good at R but I thought (at least that is what I have learned) that we have to check the distribution of the response variable when carrying out a model. Can you explain to me why the distribution of the residuals is important and not of the data? What is the point of doing the shapiro.test then ? And why/how is it possible the results of this test and the figures I got do not tell the same story ? – Marine Jul 27 '18 at 16:01
  • Please search this side. You are not the first person with this misguided concern about the distribution of the response variable in regression. There is absolutely no assumptions regarding the distribution of the response variable in regression and therefore no need to test it with the Shapiro-Wilk test. – Roland Jul 27 '18 at 18:01
  • Maybe this can get you started: https://stats.stackexchange.com/q/12262/11849 – Roland Jul 27 '18 at 18:02