2

I am trying to do a multi-scale analysis and I've stumbled upon, either by personal research or recommendations (as in this Q), with the concept of Space-scale analysis.

Do you know how can I plot things like this in R?:

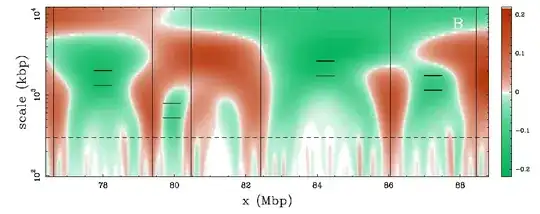
(source: Supplementary Fig. 15 from this article) scale-space representation

pedrosaurio
  • 1,283
  • 2
  • 14
  • 19
  • It is just a heat map, so if you look up examples of [heat maps in R](http://stackoverflow.com/search?q=%5Br%5D+heat+map) you should be able to find a solution. Given the density of cells in the mentioned plot, you will want to look at solutions that utilize raster graphics to plot the image as opposed to vector ones. – Andy W Aug 31 '12 at 16:07
  • 1
    Maybe I was not clear enough. What I actually want to do is the multi-scale analysis. Not the actual plot. In order to improve the question could you tell me where did my question made you misunderstand my point? – pedrosaurio Aug 31 '12 at 16:35
  • 2
    At the point where you said "Do you know how can I plot things like this in R?". It is a bit easier to answer questions that are smaller in scope, saying things like "How do I do X?" is difficult to answer besides to point to literature. It is best to show what type of research you have done so far, and if you are getting stuck at a particular point ask about that. – Andy W Aug 31 '12 at 16:40

1 Answers1

4

It sounds like you're talking about wavelet analysis? R packages include wavelets, waveslim, wmtsa, or rwt. Not sure which have nice graphing capabilities. Package dlpR is from a specific field, but I have to say its wavelet.plot plot (use its morlet function to process the data) is quite nice.

Wayne
  • 19,981
  • 4
  • 50
  • 99