0

I have been trying to forecast the results of the following data. These are weekly numbers and I have tired ARIMA and ETS and it seems I am not getting the correct results. I have set the frequency as 365.25/7 and tried auto.arima with stepwise = FALSE and approximation = FALSE. Also tried Fourier. The results that I get are as seen below. Could anyone help me understand what I am doing wrong. How do we get the up and downs (drift) in the forecast ?

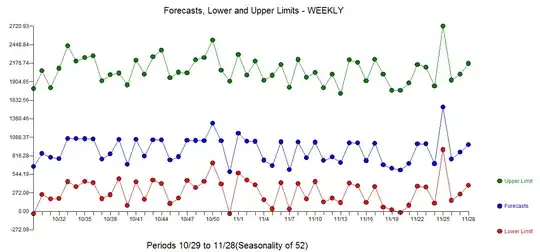
Point Forecast : 992.2797 1057.1385 1057.4956 1082.3302 1089.3869 1100.8245 1106.7030 1112.7030 1116.6169 1119.9958 1122.4300 1124.3969

Data is as follows. The information is from 2009-01-04 till 2018-06-15. I was using data from 2018 as test set.

311 1389 1006 1407 6456 1295 2419 1643 915 926 909 1165 1041 1271 2825 1034 967 3149 2188 1128 2427 1583 1049 1225 1134 1283 3861 1298 1169 1057 1220 1296 1457 2313 1511 1649 1429 944 1225 2932 1662 1068 2056 2680 1164 1350 1595 1528 1241 977 2713 2369 864 1499 2364 1317 1068 1756 1333 1148 1340 1519 1560 1326 1325 2219 1308 1283 1657 1350 1048 1134 2372 2392 1233 1495 1251 978 4284 907 909 1268 910 999 1027 2132 2397 2289 1336 1260 973 2092 1392 1155 2465 3046 927 836 2331 2956 1626 1565 2388 1984 868 1276 1045 980 2009 3757 1032 1666 1148 2032 1386 1733 1545 1910 1322 994 1990 951 1206 952 1987 2894 1598 1039 1871 1270 2705 1744 857 1819 1249 688 1848 1432 1957 2055 1069 1831 1207 1038 1819 1119 1892 2037 1200 1724 1974 1670 1853 1071 1569 2533 723 1315 1124 1053 820 1899 1017 1603 1093 1671 1115 1224 967 1853 1684 1017 811 1811 1094 1035 794 2612 1453 912 1368 857 2371 2156 883 685 1031 813 1272 1010 1876 1875 1261 888 1756 1129 1152 1039 1718 1852 1417 1782 1634 1414 1056 1069 1643 1836 1092 998 1531 1108 1020 1822 941 1081 1029 1495 981 1175 1648 1410 1186 866 1394 1253 867 732 1261 2273 1190 765 2220 1390 1384 1484 676 993 1135 830 848 810 2240 1494 856 686 1548 1018 779 1751 1593 886 685 836 841 1448 1084 755 1941 1921 1039 1093 829 1237 935 1305 824 1120 931 766 1463 1354 791 1062 803 779 1335 802 730 1177 1101 1255 1098 735 1609 1049 1109 1041 723 690 1000 1477 1034 1041 1176 1066 669 778 765 790 1436 1069 731 732 721 790 842 1203 1078 717 890 655 718 782 1265 855 1164 1173 735 1066 826 948 797 1188 816 1005 1131 736 566 1056 879 1198 1132 1253 1064 915 1351 1352 1184 1700 1005 937 1013 1322 1052 966 1356 1178 1985 1422 1051 1045 1537 1633 1543 1468 1251 1761 1483 2213 1794 2245 1170 1872 1737 1098 1283 1344 1388 1256 2408 1692 1789 2379 1209 1448 1167 2194 1480 1168 1023 1512 1333 1297 1501 1311 2672 1591 1319 1918 2003 2254 1513 1419 1675 1812 1230 1153 1500 1222 2288 1223 973 968 1058 1473 1372 1010 1257 1219 1081 2356 1645 1059 931 1973 1741 987 755 877 1210 997 1802 936 696 956 738 644 994 766 902 902 2061 925 759 752 969 793 1883 992 699 1704 813 1440 1044 902 1301 1594 959 622 1339 1092 1335 925 848 663 669 1061 1452 794 1430 884 760 1610 1226 860 806 1449 1755 1066 689 722 674 702 1499 793 613 632 618 625 649 1471 1735 811 662 718 763 1594 1353 1404 1865 953 605 983
Rohit
  • 1
  • Why do you believe you are doing something wrong? – Stephan Kolassa Jul 03 '18 at 16:44
  • There are spikes up and down while plotting the time series. but I do not get those while doing the forecast. I am confused on whether I am missing some parameters. – Rohit Jul 04 '18 at 03:13
  • 1
    What ARIMA parameters are you using? (FWIW, predicting weeks is messy: first they don't line up from year to year, second there are moving holidays, etc.) – Wayne Jul 04 '18 at 17:56
  • I did try Dynamic Harmonic regression. "Forecast from Regression with ARIMA(5,1,5) errors" – Rohit Jul 05 '18 at 07:01
  • @Wayne which is precisely why we recommend daily data to our clients. – IrishStat Jul 07 '18 at 20:17
  • 1
    @IrishStat - Based on the above replies, when you consider daily data would you set the frequency as 365 or 366 ? How would you handle leap year ? Or is that you will set a weekly frequency (7) ? – Rohit Jul 10 '18 at 09:35
  • Please see my answer to https://stats.stackexchange.com/questions/354726/count-data-time-series-for-hospital-emergency-arrivals/354889#354889 as it suggests creating a hybrid model using both dummies and arima. This is what I did with your data. I will expand my answer . – IrishStat Jul 10 '18 at 12:14

2 Answers2

1

A time series is composed of signal and noise. A forecasting method attempts to extract and extrapolate the signal, and discard the noise. (By definition, noise is random and unforecastable, so trying to forecast the noise will make the forecast worse.)

The spikes you see may be systematic, as in AR or MA dynamics, in which case they will be modeled and forecasted. Or, more likely, they are noise, in which case they will not be forecasted, and this is correct.

A forecast is always smoother than the original series, because the noise has been removed.

As to where the ups and downs come from: most likely from seasonal or ARIMA behavior your model has detected. If I fit a straightforward forecast::auto.arima() to your data (which is inappropriate, given the seasonality), I get an ARIMA(1,1,3) model, which does exhibit some dynamics.

ARIMA models are not very happy about "long" seasonal cycles. You may want to look at or models. Then again, if you have already included Fourier terms, these models will likely not improve matters dramatically.

You may want to look at some material on forecasting, e.g., Forecasting: Principles and Practice. Or at How to know that your machine learning problem is hopeless?

Stephan Kolassa
  • 95,027
  • 13
  • 197
  • 357
-1

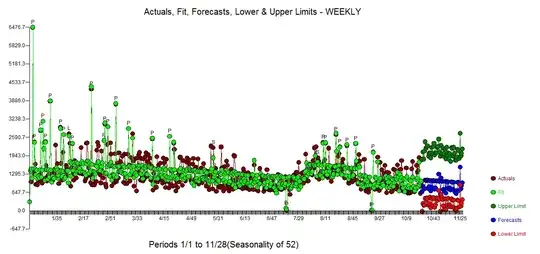
By including a time trend indicator , level shifts , some pulses , significant weekly indicators and a (1,0,0) arima structure .... this is the actual, fit and forecasts enter image description here suggesting the patterns in the past are replicated/projected into the future. No boring forecasts here !

The model is here enter image description here and here enter image description here and here enter image description here yielding forecasts here enter image description here

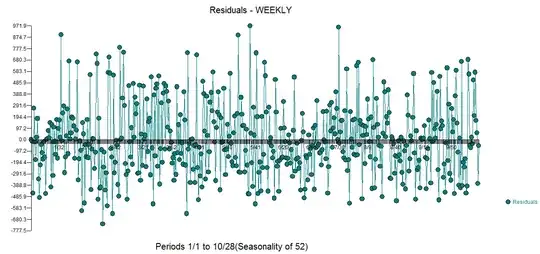
The residuals from the model suggest sufficiency enter image description here

In short analysts are often limited by their (free) tools thus you get people promoting simple memory models ...even when they are inappropriate.

Your weekly series has complications (opportunities) as changes in trend and changes in level have been detected. When you have a leap year weekly indicators often need to be modified thus the "changes in seasonal(dummy) factors".

IrishStat
  • 27,906
  • 5
  • 29
  • 55