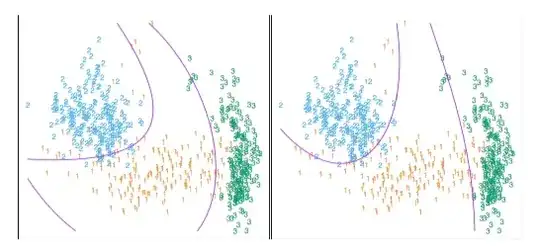
As Amoeba has highlighted in his answer, the authors of the book elements of statistical learning make use of a contour algorithm to produce visual plots of classification algorithms.
For example, for their LDA plot on page 111 the footnote mentions the following:
For this figure and many similar figures in the book we compute the decision bound- aries by an exhaustive contouring method. We compute the decision rule on a fine lattice of points, and then use contouring algorithms to compute the boundaries.
How would the implementation of such an algorithm work in practice? I would like to reproduce the algorithm in Python for simple cases and any references, examples, or even pseudo-code would be very helpful. Thanks
