7

There's a way to do survival analysis of two (or more I suppose) mutually exclusive competing risks as a mixture of two different survival curves. Something like what you see in A.C. Ghani et al. Methods for Estimating the Case Fatality Ratio for a Novel, Emerging Infectious Disease. American Journal of Epidemiology (2005) Vol. 162, No. 5

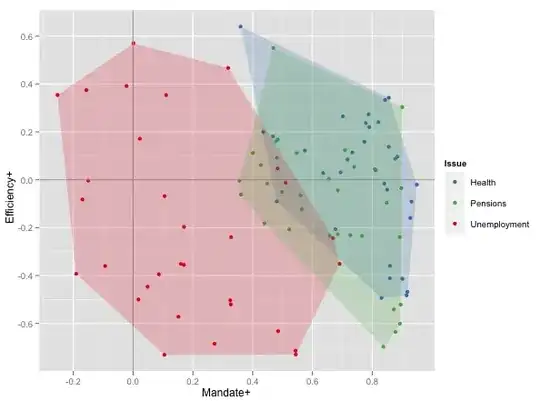
What I'm looking for is a package that would help produce something like this figure:
enter image description here

Where the survival curve of one outcome, and 1-the survival curve of the other outcome will eventually meet at a particular point that is the mixture of the two outcomes.
Michael R. Chernick
  • 39,640
  • 28
  • 74
  • 143
Fomite
  • 21,264
  • 10
  • 78
  • 137
  • You may want to consider asking this on SO, as it appears to be mainly about how to get R to do something. – gung - Reinstate Monica Aug 19 '12 at 02:21
  • @gung I considered it - I picked stats.SE because it's closer to a statistics methods/programming question in my mind, as the *composition* of two KM curves in a mixture isn't just an exercise in programming. But I could be wrong, and I won't object to it being migrated. – Fomite Aug 19 '12 at 02:25
  • I haven't got a full answer, but a place to look is "modifying the ODS template for survival plots" in the SAS documentation for PROC LIFETEST. Alternatively, you could output the needed data (using OUTEST, I think) and then make both lines fairly easily in PROC SGPLOT with SCATTER, but that wouldn't be exactly what you show. – Peter Flom Aug 19 '12 at 06:17
  • Probably this is a oversimplified suggestion, but what about "regular" competing risks? You can draw the CIF (cum. inc. function) for the first event and 1-CIF for the other one. If you have no other competing risks (i.e. these 2 events are the only possible events), the 2 curves will eventually converge. (see for example http://www.ncbi.nlm.nih.gov/pubmed/14992828) – boscovich Aug 19 '12 at 07:13
  • @andrea Usually "regular" competing risks assumes that the outcome not being modeled at the time is censored - something I'd like to question in this particular case, as the counterfactual that's implied by that is absurd in my setting. Beyond that, the answer is "because I'm trying to validate a parametric mixture of two survival curves with a non-parametric approach". – Fomite Aug 19 '12 at 16:09

3 Answers3

2

In R, a survfit.object---returned by survfit()---stores a fitted survival curve. In particular, this object contains the time points at which the curve has a step and the ordinates at those points. You can therefore construct the survival function, $t\mapsto \hat{S}(t)$, by constant interpolation. Here is the way I would do this:

km <- summary(survfit(Surv(time, event) ~ 1, data=data))
S <- approxfun(km$time, km$surv,
               method="constant", f=0, yleft=1, rule=2)

Now, S can be used as any user-defined function in R: in particular, you can evaluate S(t) at any time t, you can make plots using plot(), and you can superimpose two K-M curves on the same graph using lines(), ...

Hope this helps!

ocram
  • 19,898
  • 5
  • 76
  • 77
  • The question then is how to get a survfit.object that represents a mixture of two survival curves, rather than two independently occurring curves. – Fomite Aug 19 '12 at 16:04
  • A follow up question: how would you generate confidence intervals for `S(t)`? – andrewj Jul 27 '15 at 21:43
1

What you are asking for is a simultaneous plot of the survival function for one process and the cumulative incidence function (= 1- S(t)) for the competing process. The 'cmprsk' R package should be able to do the plots, but since the usual mode is to display both process as the cumulative incidence, you will need to do some work to transform the data so that one is S(t) and the other is H(t).

DWin
  • 7,005
  • 17
  • 32
  • While you're correct in terms of the graphing, 'cmprsk' uses the subdistribution proportional hazards model, which is...not quite what I'm looking for. – Fomite Aug 09 '13 at 06:46
  • You asked for plotting, not for inference. – DWin Aug 09 '13 at 06:47
  • You're technically correct, but properly plotting a survival function necessitates it being constructed correctly in the first place. – Fomite Aug 09 '13 at 06:51
  • I've noticed two different downvotes with no explanation in the last 2 days. If you want to correct me, then please be more "verbal". I don't think that Fomite is correct (since neither of his plots are really survival or cumulative incidence, given that one of them is bounded below by soemthing other than zero or bounded above by something other than unity, ....but I'm willing to listen to reasoned arguments. (I am, however, offended by downvotes that are unexplained.) – DWin May 14 '16 at 00:26
0

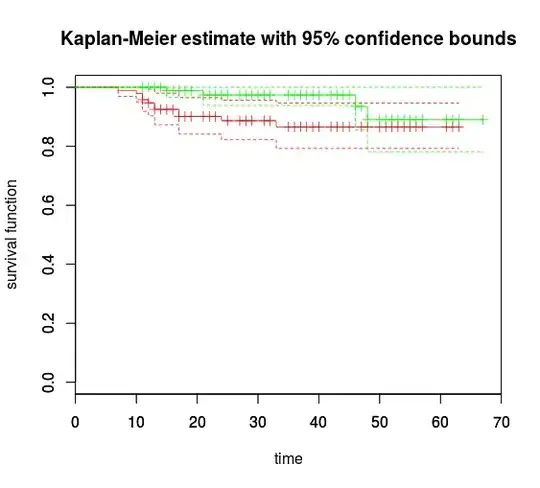
Wouldn't it be good enough if you could plot two curves using par(new=T)?

plot(survfit(KMfit1 ~ 1),main="Kaplan-Meier estimate with 95% confidence bounds",xlab="time", ylab="survival function",col="red",xlim=c(0,70))

par(new=T)

plot(survfit(KMfit2 ~ 1),col="green",xlim=c(0,70))

enter image description here

WojciechF
  • 208
  • 1
  • 9