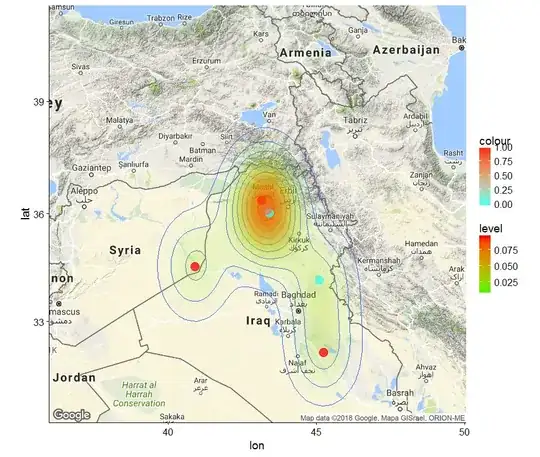
I'm trying to plot a 2d density on a worldmap. The problem is most of my points are around the same coordinates. My current map looks like this:
Code for map:
map = get_map(location = c(lon=43, lat=36), zoom = 6)
ggmap(map) +
geom_density2d(aes(x=Longitude, y=Latitude),
data =  rel ,size = 0.3) +
stat_density2d(data = rel, aes(x=Longitude, y=Latitude,
fill = ..level.., alpha = ..level..), size =0.01, bins = 16,
geom = "polygon") +
scale_fill_gradient(low = "green", high = "red") +
scale_alpha(range = c(0, 0.3), guide = FALSE)+
geom_point(aes(x=Longitude, y=Latitude, colour = Freq),alpha = 0.75,
size=5, data = rel)+
scale_colour_gradient(low = "#3afff4", high = "#fc0000")
Code for dataset:
rel = as.data.frame(matrix(0, nrow = 6, ncol = 3))
rel[1,1]=1
rel[1,2]=34.55040
rel[1,3]=40.88923
rel[2,1]=0
rel[2,2]=34.16807
rel[2,3]=45.10331
rel[3,1]=0
rel[3,2]=36.02210
rel[3,3]=43.40581
rel[4,1]=0.73
rel[4,2]=36.09917
rel[4,3]=43.32750
rel[5,1]=0.94
rel[5,2]=36.35868
rel[5,3]=43.15194
rel[6,1]=1
rel[6,2]=32.12694
rel[6,3]=45.23083
colnames(rel) = c("Freq", "Latitude", "Longitude")
Currently the map is red where a lot of the coordinates are. Now I want the density to be red where the geom_point created red dots.
How can I achieve that?