2

I already posted the same question on https://stackoverflow.com/questions/49298634/how-to-interpret-results-of-auto-arima-in-r but some one pointed to ask it on here. I would appreciate any relevant help.

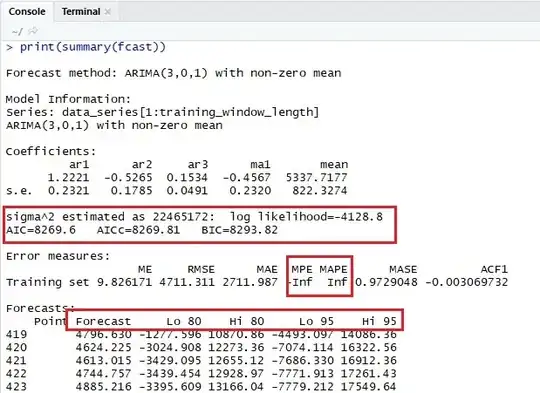
Let I have a time series X and I used fit<-auto.arima() followed by fcast <- forecast(fit, h=100). When I do print(summary(fcast)), I get a result having number of variables (snapshot of an example is attached).

  1. What is the meaning of each variable (specially, highlighted in red boxes)? If someone can explain in simple terms, it would be great.
  2. What is the meaning of getting -Inf and Inf for MPE and MAPE respectively?
  3. What is meaning of Lo 80, Hi 80, Lo 95, and Hi 95? Can I say that it is 80% likely to have actual value equal to Forecast+Lo 80+Hi 80?

enter image description here

Stephan Kolassa
  • 95,027
  • 13
  • 197
  • 357
Jitendra
  • 123
  • 1
  • 8

1 Answers1

3
  1. The first red box gives the estimated variance of the residual noise term, the log-likelihood and various information criteria: the AIC, the small-sample corrected AICc and the BIC.

    The second red box contains the Mean Percentage Error (MPE) and the Mean Absolute Percentage Error () on the training set, with some other accuracy measures. You may want to look at ?accuracy.

    The third red box contains "the" forecast. The first column contains the forecasted expectation per time period. For the others, see point 3 below.

  2. Your percentage errors are almost certainly infinite because you have zero actuals in your training sample, so calculating percentage errors entails a division by zero, which is undefined. In such a case, percentage errors are not helpful. (The MAPE - and also the MPE - has other shortcomings, too.)

  3. The "Lo 80" column gives the lower boundary of an 80% . Specifically, it gives the 10% quantile of the predictive density, which is calculated using a normality assumption. The hope is that this 80% PI will contain 80% of future realizations. Note that PIs are notoriously too narrow. "Hi 80" analogously gives the upper boundary of the 80% PI, and the same for "Lo 95" and "Hi 95".

You may be interested in Forecasting: Principles and Practice, a free online forecasting textbook.

Stephan Kolassa
  • 95,027
  • 13
  • 197
  • 357
  • prediction interval and confidence interval are same? – Jitendra Mar 16 '18 at 10:10
  • Good question! No, they aren't. CIs pertain to *unobservable* parameters (e.g., the expectation of the future time series), PIs to *observable* realizations. [See also here.](https://stats.stackexchange.com/tags/prediction-interval/info) This is frequently confused. – Stephan Kolassa Mar 16 '18 at 10:16
  • `fcast$fitted` will give you the *in-sample fits*. To get the mean point forecasts, use `fcast$mean`. See `?forecast`. If you have nonsensical negative values, that is a separate problem. [We have some related questions here.](https://stats.stackexchange.com/search?q=%5Bforecast%5D+negative+is%3Aq) – Stephan Kolassa Mar 20 '18 at 07:10
  • `fcast$mean` gives the mean point forecasts. How can I compute errors in future forecasts? Is it difference between `fcast$mean` and `actual`? If possible can you give me an expression that can compute `RMSE`. For instance, some thing like `sqrt(mean((fcast$mean - fcast$x)^2))` – Jitendra Mar 21 '18 at 19:15
  • Easiest would be to use the `accuracy()` function. Look at `?accuracy`. – Stephan Kolassa Mar 21 '18 at 20:50
  • Thank you for helping me consistently and I am sorry for asking so many questions. Actually, ARIMA is new to me. I have been used population based heuristics such as PSO approaches to model a forecaster. In these approaches we get `forecasts` and we can compute the errors by comparing the `forecasts` with `actuals`. Now I want to understand the `auto.arima`'s mechanism of computing error in forecast. Is it `fcast$fitted - fcast$x` or `fcast$mean - fcast$x`. – Jitendra Mar 22 '18 at 16:35
  • You will need to use `fcast$mean` and compare it with whatever object holds your actuals. The output of `forecast.Arima()` will not contain any holdout actuals (how should it?). Have you looked at the help page for `accuracy()`, specifically the examples? – Stephan Kolassa Mar 22 '18 at 16:39
  • On running the following code `rm(list=ls()) library(forecast) set.seed(159357025) data_rand = round(runif(100,10,100), 0) fit – Jitendra Mar 22 '18 at 17:38
  • Strange. I get no error. `accuracy(fit)` gives me the training set accuracy, as it should. I am running R 3.4.4 and forecast 8.2. If your error persists after updating (if necessary), I'd recommend you ask on StackOverflow in the R tag. – Stephan Kolassa Mar 22 '18 at 19:50
  • Actually `forecast::accuracy` was masked by `Metrics::accuracy`. I made changes accordingly and now its working. Thanks for help. – Jitendra Mar 23 '18 at 05:07
  • In point no. 2 of your reply, you indicated that `MPE` and `MAPE` are `Inf` becasue of zeros in actual values. Is it a good idea to rescale the `actual` values to some positive scale e.g. (1, 5)? – Jitendra Mar 23 '18 at 05:45
  • If you shift the time series to get rid of zeros, the resulting MPE and MAPE will depend on the amount that you shifted it by, which is arbitrary. Better to just disregard percentage errors if your series contains zeros. – Stephan Kolassa Mar 23 '18 at 07:30