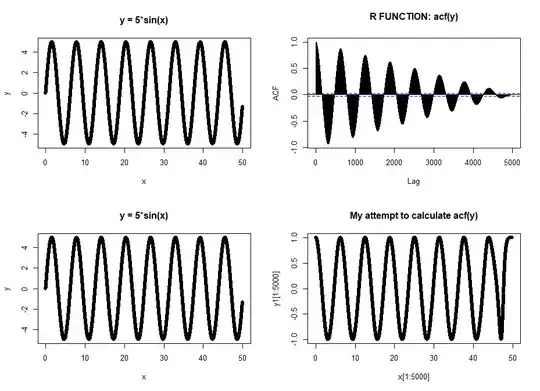
Trying to self teach a bit about autocorrelation. For a simple sine wave, I am surprised that the acf() function in R outputs a curve that converges to 0. From my understanding, the autocorrelation function would rebound to 1 for each period of the wave, as in my attempt to manually calculate acf. Picture and code are below.
My basic question is: How does acf() compute autocorrelation? This will help me figure out how my interpretation of what autocorrelation is, is wrong!
par(mfrow=c(2,2))
x = seq(0,50,0.01)
y = 5*sin(x)
plot(x,y,pch=19,main="y = 5*sin(x)")
acf(y,lag=length(y),main="R FUNCTION: acf(y)")

#My calculation of ACF
y1 = rep(0,length(y)+1)
for (i in 0:length(y)){
y1[i+1] = cor(y[1:(length(y)-i)],y[(1+i):length(y)])
}
plot(x,y,pch=19,main="y = 5*sin(x)")
plot(x[1:5000],y1[1:5000],pch=19,main="My attempt to calculate acf(y)")
