Analysis
The question is this: given a set of whole numbers $x_1, x_2, \ldots, x_m$ (as given in the graphic) that have been obtained from some process of converting corresponding whole numbers $y_1, y_2, \ldots, y_m$ (the raw response counts) to percents and rounding, find the range of possible values of $n = y_1+y_2+\cdots + y_m$ (the total of the responses).
Observe that
The smallest possible value of $n$ is less than or equal to $s(x)=x_1+x_2+\cdots+x_n$ because $y_i=x_i$ is a solution with $n=s(x).$
$n$ can be arbitrarily large, because all values of the form $n=ks(x)$ obviously work for $k=1, 2, 3, \ldots,$ since $y_i=kx_i$ is such a solution.
In time proportional to $m$ we can check whether any particular candidate for $n$ works by trying to recover $y_i$ as the rounded version of $n x_i/100$, applying the rounding procedure to the resulting array of $y$'s, and checking whether it produces the $x$'s we have been given.
There are some subtleties to this formulation. One is that the sum of the rounded versions of the $n x_i/100$ might not equal $n$ anymore. For example, with $x=(20,30,50)$ and checking $n=19$, the fractions $19(20,30,50)/100=(3.8,5.7,9.5)$ round to $(4,6,10)$ which sums to $20\ne 19.$ There are various procedures to avoid such problems related to inconsistencies between rounded and unrounded versions of proportions. We have no way of knowing what procedure The Guardian may have used.
I have explored rounding procedures of the following form. They consist of computing the cumulative sums of the $y_i$: $$s_0=0, s_1=y_1, s_2=y_1+y_2,\ \ldots,\ s_m=y_1+y_2+\cdots+y_m.$$
These are individually and independently rounded to percents of the total, yielding corresponding whole numbers $0=t_0 \le t_1\le t_2\le \cdots \le t_n=100.$ The rounded version of $y_i$ is computed as the difference $t_i-t_{i-1}$. This guarantees the rounded versions sum to $t_n=100.$
Consider the raw counts $y=(5,9,10).$ The preceding procedure yields $x=(21,37,42).$ If, however, we were to reorder the values of $y$, we could also obtain $(20,38,42)$ and $(21,38,41)$ for the reported values $x$. This demonstrates that the result of rounding a sequence of values is not necessarily unique.
Solutions
The data in the question are $x= (3,16,4,4,32,15,3,12,6,5).$ By checking all $n$ from $1$ through $100$, I found that the smallest $n$ allowing $x$ to be perfectly reconstructed with this procedure is $n=73$, for which
$$y = (2, 12, 3, 3, 23, 11, 2, 9, 4 , 4).$$
By sorting $y$ (either ascending or descending), which I believe is often done, the solution is $n=63,$ for which
$$y = (2, 2, 2 , 3, 3, 4, 7, 10, 10, 20).$$
In general, there will be in toto $10!$ (over three million) permutations of $x$ to explore if one wishes to find the absolute smallest possible $n$. (In this case, repetitions in the values of $x$ decrease that count by an order of magnitude, but it's still a lot of computation--and reflects an approach that scales very badly with the length of $x$.) I instead looked at over 50,000 random permutations. Several of them yield $n=40$ (and most others yield $n=53$ or larger). Here's one obtained by reordering $x$ as $(32, 3, 5, 15, 3, 4, 16, 4, 6, 12)$:
$$y = (13, 1, 2, 6, 1, 2, 6, 2, 2, 5).$$
This allows us to conclude that the total number of responses may have been as low as $40$, depending on how the rounding was done.
The figure is a histogram of the smallest values of $n$ found for the last 10,000 permutations I looked at. The lowest value is $40$ (whose bar is too short to be seen at this resolution).
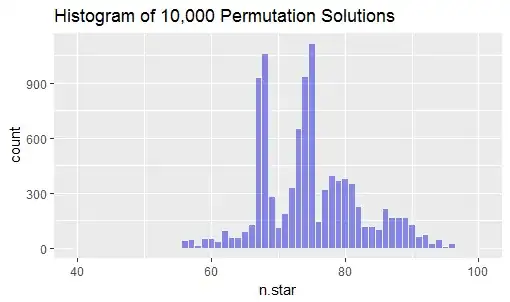
You can see from the groups of tallest bars that most permutations require somewhere around 67, 75, 80, or more raw responses (that is, two-thirds, three-quarters, or four-fifths of 100). If we were to consider all permutations of the ten results to be equally likely, and also if we were to suppose it was not a large survey, then numbers in these ranges would be good a posteriori bets concerning how many responses were obtained.

