2

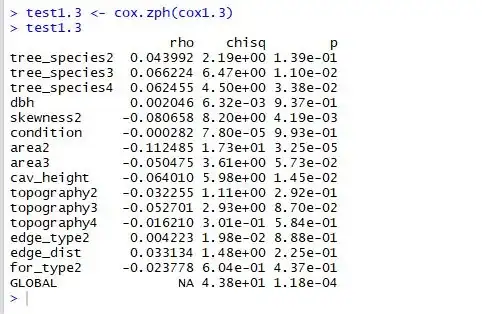
below you can see the cox.zph function to test for proportional hazards used on my data.

Issue number 1: there are multiple violations of the proportional hazards assumption (these are tree_species 3 and 4, Skewness, Area 2 and Cavity height). Do I prioritise stratifying/making an interaction with time for the most significant variable first and then check the assumption again (and again until at least the global assumption is met)? Or do I correct them all at the same time?

Issue number 2: the variable tree_species has 4 levels. Just tree_species 3 and 4 violate the PH assumption. Do I correct this variable despite tree_species 2 not having any issues? Same goes for the variable "area".
results of checking the proportional hazards assumption Schoenfeld residual plots

  • It looks like you are missing at least one factor in your model. – Gumeo Feb 21 '18 at 11:33
  • How so? Can you elaborate? – Alwin Hardenbol Feb 21 '18 at 13:54
  • In many of the plots you provide, the points form *2-separate lines*, that means (if these are residuals) that you are missing a factor, describing either of these groups. I do not completely understand your question. You could try to explain it a little better, e.g. what exactly is in these plots. – Gumeo Feb 21 '18 at 14:00
  • I think it’s just showing e.g. in the skewness 2 plot the skewness 1 and skewness 2 residuals. But I am not so good with stats to be honest. However, searching online you find more plots that look like this with this analysis. – Alwin Hardenbol Feb 21 '18 at 14:52
  • [There are some resources here](http://www.sthda.com/english/wiki/cox-model-assumptions), otherwise I feel like you need to put more effort into your question before someone will answer it, e.g. describe the dataset, and the problem that you are trying to solve. The way it is presented now, has little context. – Gumeo Feb 21 '18 at 15:06
  • 1
    @Gumeo the plot of Schoenfeld residuals always forms two lines. – AdamO Feb 21 '18 at 15:18
  • @AdamO ok thanks, that clears things up for me. Was starting to read up on hazard models. But I think someone else is better suited than me to answer this question. – Gumeo Feb 21 '18 at 15:20

1 Answers1

1

Be cautious about assessing model fit statistics with tests. The statistical significance of a test is usually more of a reflection of the sample size. If there are non-constant HRs, the choice boils down to your desired application and the power of the sample.

  1. Use robust standard errors. Within reason, when the hazard ratios are non-constant across time, what the Cox model estimates is the time-averaged hazard ratio which is also useful provided the design is representative of the population of interest. The only issue is that the Cox model does not calculate the correct standard errors using the model based approach. Robust standard errors will generally calculate the same coefficients but different standard errors.

    Since they have deprecated the robust=TRUE command, it is done by specifying cluster. For independent data, each observation is its own cluster.

  2. Increase the models sophistication. Adjust for the interaction between (the log of) time (at risk) and coefficients. This explicitly models the hazard ratio over various levels of time and you can assess and describe how it changes.

AdamO
  • 52,330
  • 5
  • 104
  • 209