0

I have a 10k lines dataframes on which I want to perform ANCOVA so I can get adjusted means.

Please note that I've never done this before so I jump from a tutorial to another, but I still want to make it the right way.

So my model is like Y ~ X * sex, with

  • Y the dependant variable (continuous)
  • X the continuous independant variable
  • sex the discrete independant variable (here the sex)

Reading this tutorial, I could calculate the Y mean adjusted on X for each sex :

model = aov(Y~sex*X, data=x)
data.predict = data.frame(sex=c("Male", "Female"), X=mean(x$X, na.rm=T))
data.frame(data.predict, Y=predict(model, data.predict))

This gives realistic results, but I realized that anova(aov(Y~sex*X, data=x)) and anova(aov(Y~X*sex, data=x)) give very different results. The calculated means are the same with both models though.

Reading the EdM answer in the question https://stats.stackexchange.com/a/213358/81974, I tried with the car package and Anova(model, type="III"), and this time both give the same results.

I don't really understand how it could matter, but it seems that my data are unbalanced (the aov help "Note" says that it could be misleading).

Knowing this, are the previously calculated adjusted means still usable ?
Dan Chaltiel
  • 1,089
  • 12
  • 25

2 Answers2

1

(Note: this answer will be mostly about using R, but hopefully the discussion of statistical concepts will keep it on-topic for this site.)

1) [EDIT: Comments on unbalanced designs deleted. See comments below by @rvl and @SalMangiafico]

2) By default, R uses Type I Sums of Squares. The Anova function allows you to use Type II or Type III. For Type III you will need to change the contrasts R uses to code dummy variables.

3) For adjusted (marginal or least square) means, you can use the emmeans package.

The following is a short example in R. The marginal means of Y for Male and Female are similar, but their arithmetic means are quite different due to the influence of the variable X.

[EDIT: I changed the code below to produce the e.m. means for the X:Sex interaction rather than for the main effect of Sex, as per comment by @rvl. For this model this change doesn't affect the result.]

if(!require(car)){install.packages("car")}
if(!require(emmeans)){install.packages("emmeans")}

set.seed(5)

X   = c(1,2,3,4,5,6,7,8,9,10,11,12,13,14,15,16,17,18,19,20)
Y   = X + rnorm(20, 0, 1)
Sex = c(rep("Male", 10), rep("Female", 10))

Data = data.frame(Y, X, Sex)

mean(Y[Sex=="Male"])

   ### 
   ### [1] 5.421148
   ###

mean(Y[Sex=="Female"])

   ###
   ### [1] 15.01774
   ###

model = lm(Y ~ X + Sex + X:Sex, data = Data)

library(car)

Anova(model)

   ### Anova Table (Type II tests)
   ###
   ### Response: Y
   ###            Sum Sq Df  F value   Pr(>F)    
   ### X         149.664  1 158.3660 1.03e-09 ***
   ### Sex         0.007  1   0.0069   0.9347    
   ### X:Sex       0.104  1   0.1096   0.7449    
   ### Residuals  15.121 16  

library(emmeans)

marginal = emmeans(model, ~ X:Sex)

marginal

   ###  Sex      emmean        SE df lower.CL upper.CL
   ###  Female 10.38104 0.6171581 16 9.072726 11.68936
   ###  Male   10.30839 0.6171581 16 9.000076 11.61671 
Sal Mangiafico
  • 7,128
  • 2
  • 10
  • 24
  • That caution about balance only applies when you have an `Error()` term in the model formula. Otherwise, `aov()` is essentially the same as `lm()`. Also, generally you should *not* compute EMMs for factors that are included in an interaction in the model, unless you do them separately for the interacting factor. The warning message to that effect was apparently omitted from the output shown here. – Russ Lenth Jan 09 '18 at 01:35
  • Thanks for your answer. The `emmeans` function is very interesting and give the nearly same results as my hand computations, which is nice. But as you stated my question was not about how to compute them but about whether I am allowed to do so. Anyway, please keep your post alive as I'm sure it will be very useful to other people. – Dan Chaltiel Jan 09 '18 at 10:21
  • I made some edits to my original answer. – Sal Mangiafico Jan 09 '18 at 11:55
  • 1
    Because you have unbalanced data, the type-I SS used by `aov` will give different results in anova tables depending on the order of the factors in the model. As your results suggest, this does not affect the adjusted means whether you use your method from predicted values or the `emmeans` package. You might also note that the results from `summary.lm` will be the same for either model: `modela = lm(Y ~ X*Sex, data = Data); summary(modela); modelb = lm(Y ~ Sex*X, data = Data); summary(modelb)` – Sal Mangiafico Jan 09 '18 at 12:22
  • I’d really like to see more emphasis on plotting and less on tests and calculations. The most important thing is understanding what you have, and what your model predicts. Then you’re not blindly plunging into calculations and inferences. – Russ Lenth Jan 11 '18 at 03:26
1

You have to be careful when you have factors interacting with covariates. Let me modify @Sal Mangiafico's example to provide a clearer illustration.

Data = transform(Data, Y = Y + (3 - 4*X)*as.numeric(Sex))
model2 = lm(Y ~ X + Sex + X:Sex, data = Data2)

Now we have:

emmeans(model2, ~ Sex:X)
## Sex       X    emmean        SE df  lower.CL  upper.CL
## Female 10.5 -28.61896 0.6171581 16 -29.92727 -27.31064
## Male   10.5 -67.69161 0.6171581 16 -68.99992 -66.38329

compared with what you get if you look at the max and min of X:

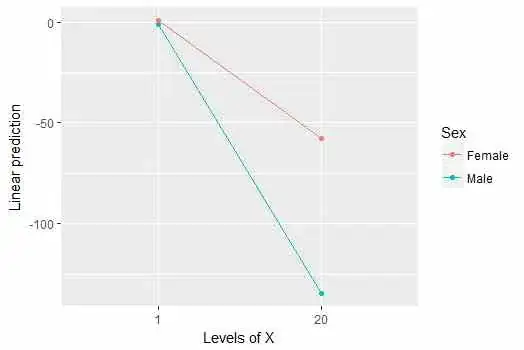
emmeans(model2, ~ Sex:X, cov.reduce = range)
 ## Sex     X       emmean        SE df    lower.CL     upper.CL
 ## Female  1    0.5713260 1.5820724 16   -2.782518    3.9251696
 ## Male    1   -0.9773716 0.5713774 16   -2.188638    0.2338944
 ## Female 20  -57.8092402 0.5713774 16  -59.020506  -56.5979743
 ## Male   20 -134.4058425 1.5820724 16 -137.759686 -131.0519988

This illustrates why plotting the results is so important:

emmip(model2, Sex ~ X, cov.reduce = range)

Interaction plot of EMMs

For more discussion, see the vignette on interactions in the emmeans package.

Russ Lenth
  • 15,161
  • 20
  • 53