What are the standard statistical tests to see if data follows exponential or normal distributions?
Asked
Active
Viewed 2.3k times
13
-
2The best test probably depends on why exactly you're testing for normality/exponential (so some background would be helpful) but you can always use the Kolmogorov Smirnov test to test whether a given data set fits any pre-specified distribution (http://en.wikipedia.org/wiki/Kolmogorov%E2%80%93Smirnov_test). There are lots of methods used for the normal distribution specifically: http://en.wikipedia.org/wiki/Normality_test – Macro Jul 10 '12 at 22:53
-
The variables I'm dealing with are likely to follow normal or exponential distributions. Also, I have a factor which I don't care for. However, it imposes some variabilities on my data. Hence, I'd like to normalize the variables to suppress the effect of this nuisance factor. So, I thought it's better to normalize each varible based on their underlying distribution. That's why I need a test to decide between these two distributions. – smo Jul 10 '12 at 23:23
-
1What does normalize mean in this sentence: *I thought it's better to normalize each varible based on their underlying distribution*? – Macro Jul 11 '12 at 00:11
-
2While not a test, [Q-Q plots](http://en.wikipedia.org/wiki/Q-Q_plot) are awesome for making a quick intuitive inspection of whether your data matches a distribution. – naught101 Jul 11 '12 at 00:26
5 Answers
14
It seems that you're trying to decide whether to model your data using the normal or the exponential distribution. This seems somewhat strange to me, as these distributions are very different from each other.
The normal distribution is symmetric whereas the exponential distribution is heavily skewed to the right, with no negative values. Typically a sample from the exponential distribution will contain many observations relatively close to $0$ and a few obervations that deviate far to the right from $0$. This difference is often easy to see graphically.
Here is an example where I've simulated $n=100$ observations from a normal distribution with mean $2$ and variance $4$ and an exponential distribution with mean $2$ and variance $4$:
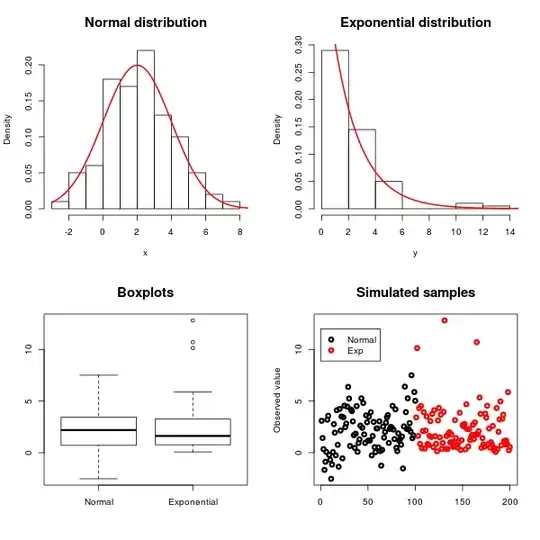
The symmetry of the normal distribution and the skewness of the exponential can be seen using histograms, boxplots and scatterplots, as illustrated in the figure above.
Another very useful tool is a Q-Q-plot. In the example below, the points should approximately follow the line if the sample comes from a normal distribution. As you can see, this is the case for the normal data, but not for the exponential data.
If graphical examination for some reason isn't enough for you, you can still use a test to determine whether your distribution is normal or exponential. Since the normal distribution is a scale and location family, you'll want to use a test that is invariant under changes in scale and location (i.e. the result of the test should not change if you change your measurements from inches to centimetres or add $+1$ to all your observations).
When the null hypothesis is that the distribution is normal and the alternative hypothesis is that it is exponential, the most powerful location and scale invariant test is given by the statistic $$T_{E,N}=\frac{\bar{x}-x_{(1)}}{s}$$ where $\bar{x}$ is the sample mean, $x_{(1)}$ is the smallest observation in the sample and $s$ is the sample standard deviation. Normality is rejected in favour of exponentiality if $T_{E,N}$ is too large.
This test is actually a one-sided version of Grubbs' test for outliers. You'll find this implemented in most statistical software (but make sure that you use the right version - there are several alternative test statistics used for the outlier test!).
Reference for $T_{E,N}$ being the most powerful test: Section 4.2.4 of Testing for Normality by H.C. Thode.
MånsT
- 10,213
- 1
- 46
- 65
-
The OP asked if you test for normality what test would you choose adn in a separate situation if you test for exponential what test would you use. I didn't read inot the statement that he was suggesting trying both tests on the same data set. – Michael R. Chernick Jul 11 '12 at 10:25
-
I interpreted it in that way, since in a follow-up comment to the question, the OP wrote "The variables I'm dealing with are likely to follow normal or exponential distributions. [...] That's why I need a test to decide between these two distributions." – MånsT Jul 11 '12 at 10:31
-
I didn't notice that. In that case your answer is very appropriate. I was answering as if he were testing for one at a time. – Michael R. Chernick Jul 11 '12 at 10:35
-
@Michael: I interpreted it that way when I read the original question as well, but decided to write my answer after reading the comment. Otherwise, I don't think that there'd be much to add to your (+1) answer (other than the small remarks I made in a comment there). – MånsT Jul 11 '12 at 10:37
6
For the exponential distribution, you can use a test called Moran's or Bartlett's test. The test statistic $B_n$ involves the sample mean $\overline{Y}$ as well as the sample mean $\overline{\log Y}$ of the logged $Y_i$ $$ B_n = b_n \times \left\{\log \bar{Y} - \overline{\log Y} \right\} \qquad b_n = 2n \times \left\{1+ (n+1)/(6n) \right\}^{-1} $$ Under the null hypothesis we have approximately $B_n \sim \chi^2(n-1)$ and a two-sided test works. This test is designed against gamma alternatives.
See K.C. Kapur and L.R. Lamberson Reliability in engineering design. Wiley 1977.
Yves
- 4,313
- 1
- 13
- 34
-
2I came across some more recent and extensive ressources on testing for exponentiality. 1) An article: A Henze, N. and Meintanis, S.G. (2005): 'Recent and classical tests for exponentiality: a partial review with comparisons'. Metrika, vol. 61, pp. 29–45. 2) A CRAN R package named 'exptest' implementing the tests of the mentioned article. – Yves Sep 06 '13 at 09:04
-
Distribution of B_n is not very clear. Is it Chi square with n-1 df, or Chi square with n-1 df multiplied by n-1 ? – Dovini Jayasinghe Mar 15 '19 at 08:05
-
-
Thanks. So it should be the multiplication as I could see. In the sense, the degrees of freedom should be n-1? – Dovini Jayasinghe Mar 15 '19 at 10:01
-
Sorry, I missed the point in your question about the notation. So the statistics $B_n$ follows approximately the chi-square distribution with $n-1$ degree of freedom. – Yves Mar 15 '19 at 10:11
4
For normality Anderson-Darling and Shapiro-Wilk are considered the best. For the exponential Lillerfors test is designed specifically for it.
Michael R. Chernick
- 39,640
- 28
- 74
- 143
-
5this answer could be improved with a little detail on why each test is considered good/better than others. – naught101 Jul 11 '12 at 00:24
-
These tests are better in the sense that are the most powerful to departures from normal (Anderson-Darling) and exponential (Lillefors). I don't think it is easy based ont he form of the test to provide an ituitive explanation. – Michael R. Chernick Jul 11 '12 at 01:07
-
3@Michael: The Anderson-Darling test for normality (like the Shapiro-Wilk dito) has respectable power against a wide range of alternatives, but it certainly isn't the most powerful (neither in general or on average). The choice of test should depend on the alternative at hand. I've never heard of the Lillerfors test - did you mean the [Lilliefors test](http://en.wikipedia.org/wiki/Lilliefors_test) (which is actually a test for normality and not a test for exponentiality)? – MånsT Jul 11 '12 at 07:54
-
Of course I was referring to Lillefors test for exponentiality as it was the one I was suggesting for exponential distribution assumptions. I listed Shapiro-Wilk adn Anderson-Darling because to the best of my knowledge they are among the most powerful among tests for normality. What are the more powerful tests that you are referring to? – Michael R. Chernick Jul 11 '12 at 10:22
-
1It depends on what type of alternative you have. Against skew alternatives, for instance, the sample skewness is often more powerful than S-W and A-D. The latter are omnibus tests that are pretty good on average, but if you know what kind of non-normality you are worrying about, it is better to use a directed test (such as the sample skewness test, which is directed at skew alternatives). – MånsT Jul 11 '12 at 10:33
4
Have you considered graphical methods to see how the data behaves?
Probability graph techniques usually involves ranking the data, applying the inverse CDF and then plotting the results on the Cartesian plane. This allows you to see if several values deviate from the hypothesized distribution and possibly account for the reason for the deviation.
Schenectady
- 61
- 3
0
 As shown in this table, there are a lot of tests for exponentiality. Please refer to this paper for detail (with table above taken from it):
 Rahman M, Wu H. Tests for exponentiality: A comparative study[J]. Am. J. Appl. Math. Stat., 2017, 5(4): 125-135.
Of course, many of you guys may just want to use a Python package to test whether your data follows a gaussian or exponential distribution. For this end, I suggest you trying Anderson-Darling test, and here is a link scipy.stats.anderson that shows how to use it in Python.
Z.LI
- 101
- 4