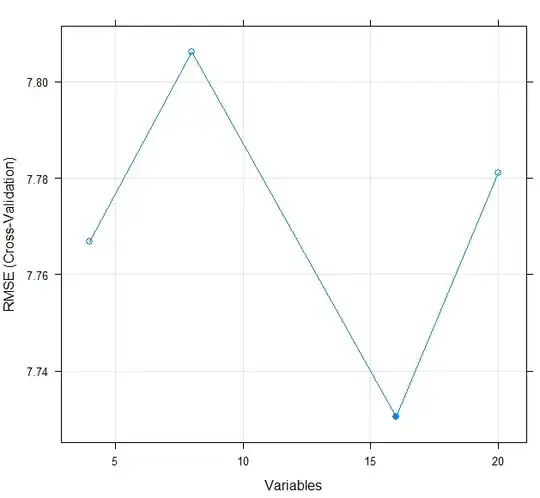
I'm using the Boruta package in R to select the best variables used then for my predictive model. Then I plotted the results from cross validation but I don't understand its meaning.

How can I Interpret this plot?
I'm using the Boruta package in R to select the best variables used then for my predictive model. Then I plotted the results from cross validation but I don't understand its meaning.

How can I Interpret this plot?