15

I would love to perform a TukeyHSD post-hoc test after my two-way Anova with R, obtaining a table containing the sorted pairs grouped by significant difference. (Sorry about the wording, I'm still new with statistics.)

I would like to have something like this:

enter image description here

So, grouped with stars or letters.

Any idea? I tested the function HSD.test() from the agricolae package, but it seems it doesn't handle two-way tables.

chl
  • 50,972
  • 18
  • 205
  • 364
stragu
  • 429
  • 1
  • 4
  • 12

2 Answers2

24

The agricolae::HSD.test function does exactly that, but you will need to let it know that you are interested in an interaction term. Here is an example with a Stata dataset:

library(foreign)
yield <- read.dta("http://www.stata-press.com/data/r12/yield.dta")
tx <- with(yield, interaction(fertilizer, irrigation))
amod <- aov(yield ~ tx, data=yield)
library(agricolae)
HSD.test(amod, "tx", group=TRUE)

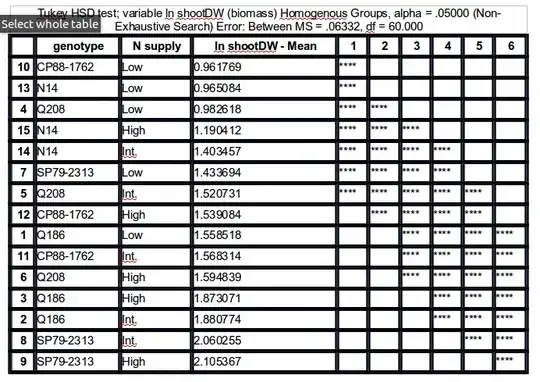
This gives the results shown below:

Groups, Treatments and means
a        2.1     51.17547 
ab       4.1     50.7529 
abc      3.1     47.36229 
 bcd     1.1     45.81229 
  cd     5.1     44.55313 
   de    4.0     41.81757 
    ef   2.0     38.79482 
    ef   1.0     36.91257 
     f   3.0     36.34383 
     f   5.0     35.69507 

They match what we would obtain with the following commands:

. webuse yield
. regress yield fertilizer##irrigation
. pwcompare fertilizer#irrigation, group mcompare(tukey)

-------------------------------------------------------
                      |                           Tukey
                      |     Margin   Std. Err.   Groups
----------------------+--------------------------------
fertilizer#irrigation |
                 1 0  |   36.91257   1.116571    AB    
                 1 1  |   45.81229   1.116571      CDE 
                 2 0  |   38.79482   1.116571    AB    
                 2 1  |   51.17547   1.116571         F
                 3 0  |   36.34383   1.116571    A     
                 3 1  |   47.36229   1.116571       DEF
                 4 0  |   41.81757   1.116571     BC   
                 4 1  |    50.7529   1.116571        EF
                 5 0  |   35.69507   1.116571    A     
                 5 1  |   44.55313   1.116571      CD  
-------------------------------------------------------
Note: Margins sharing a letter in the group label are
      not significantly different at the 5% level.

The multcomp package also offers symbolic visualization ('compact letter displays', see Algorithms for Compact Letter Displays: Comparison and Evaluation for more details) of significant pairwise comparisons, although it does not present them in a tabular format. However, it has a plotting method which allows to conveniently display results using boxplots. Presentation order can be altered as well (option decreasing=), and it has lot more options for multiple comparisons. There is also the multcompView package which extends those functionalities.

Here is the same example analyzed with glht:

library(multcomp)
tuk <- glht(amod, linfct = mcp(tx = "Tukey"))
summary(tuk)          # standard display
tuk.cld <- cld(tuk)   # letter-based display
opar <- par(mai=c(1,1,1.5,1))
plot(tuk.cld)
par(opar)

Treatment sharing the same letter are not significantly different, at the chosen level (default, 5%).

enter image description here

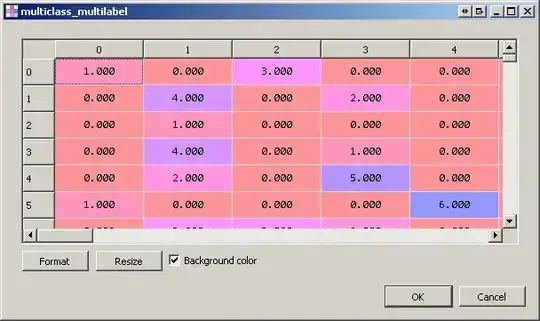
Incidentally, there is a new project, currently hosted on R-Forge, which looks promising: factorplot. It includes line and letter-based displays, as well as a matrix overview (via a level plot) of all pairwise comparisons. A working paper can be found here: factorplot: Improving Presentation of Simple Contrasts in GLMs

chl
  • 50,972
  • 18
  • 205
  • 364
  • Thank you so much for this exhaustive answer! I will be trying those different methods as soon as I get a few minutes. Cheers! – stragu Jul 07 '12 at 13:51
  • I tried the multcomp package function, put when I use the 'cld()' function I get the error 'Error: sapply(split_names, length) == 2 is not all TRUE' Any idea why? – stragu Jul 11 '12 at 10:03
  • 1
    @chtfn There seems to be a problem with variable labels. A quick look at the source code indicates that this error message comes from `insert_absorb()` which tries to extract pair of treatments. You can perhaps try to change the separator you used for coding levels of your interaction term? Without a working example, it's hard to tell what happened. – chl Jul 11 '12 at 10:14
  • I figured it out: I had points in my genotypes and treatments' names, and as qlht() uses a point to divide the pair names, it freaked out. Thank you so much for all your help, chl! :) – stragu Jul 11 '12 at 15:02
  • 3
    I noticed today that I now have to add `console=TRUE` in `HSD.test()` in order to get the tables, in case someone tries this and sees no result. Probably an update of `agricolae`. – stragu Nov 18 '13 at 06:07
3

There's a function called TukeyHSD that, according to the help file, calculates a set of confidence intervals on the differences between the means of the levels of a factor with the specified family-wise probability of coverage. The intervals are based on the Studentized range statistic, Tukey's "Honest Significant Difference" method. Does this do what you want?

http://stat.ethz.ch/R-manual/R-patched/library/stats/html/TukeyHSD.html

smillig
  • 2,336
  • 28
  • 31
  • Thank you for your response. Yes, I tried this function, but it gives me raw lists of comparisons. What I would like is to see them grouped like in the image in my question, to have a clear view of which group differs to which group, and eventually add the group names on my graphs (for example: a, ab, abc, bc, c) – stragu Jul 05 '12 at 07:18