I took your 273 monthly values and introduced them to AUTOBOX. Here is the plot of the data  and the acf
 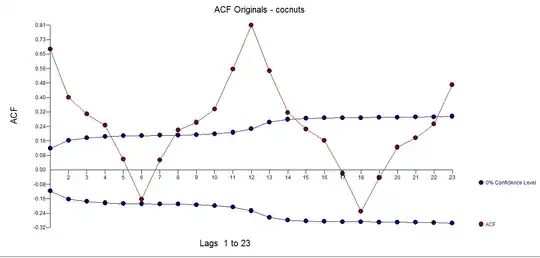 . A plausible model was developed with the following acf of the model residuals
 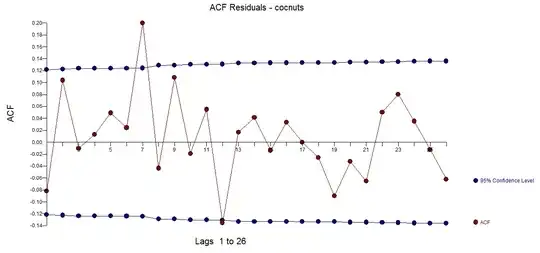 and a plot of the residuals
 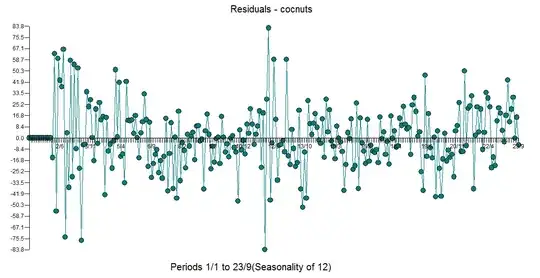 both suggesting a sufficient model that separated signal and noise.
The Actual/Fit/Forecast is here 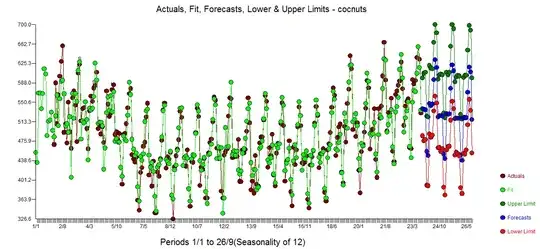 with forecasts here
  . The Cleansed/Actual graph presents the detection of deterministic structure
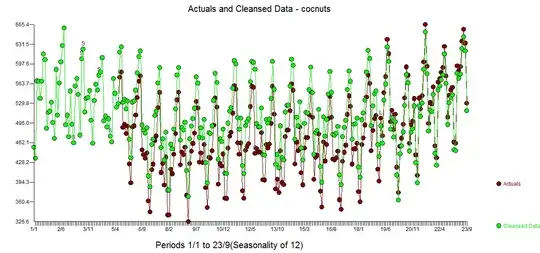
The model building strategy is to iterate (not 1 step ) to a plausible/useful model. Since a very significant seasonal structure is present , AUTOBOX tested an ARIMA approach first BUT found that the dominant structure was causal/deterministic in form. Seasonal differencing /ar structure is one way to deal with seasonal data by using memory while a regression based model with seasonal dummies /level shifts/time trends is often superior as a starting model.
In this case AUTOBOX concluded through a comprehensive search that the best initial step was to incorporate seasonal dummies for the five months 1,2,6,7, and 8 suggesting that there is no needed seasonal deterministic response to months 3,4,5,9,10,11,12 . These seasonal factors are directly attributable above and beyond any autoregressive seasonal effect.
Additionally it found intercept changes at period 55 and 219 suggesting three regimes 1-54 ; 55-218 and 219-273. These three regimes are clearly evident from the descriptive graph. Additionally it was found necessary and sufficient to incorporate an AR(1) and an AR(12) component reflecting overall month-to-month dependence. One anomaly was detected at period 140.
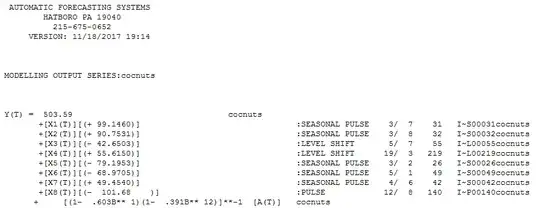 finally the model form and here
  and here
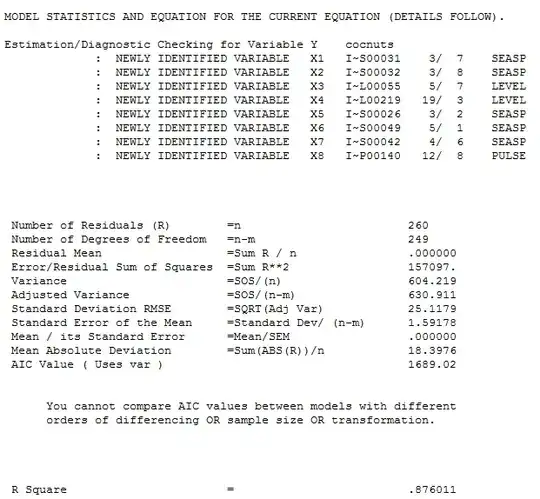
Model formulation is done iteratively by examining the significance of included coefficients while examining the residuals for both deterministic and ARIMA structure.
In summary two level shifts are needed to make the series stationary. De-meaning is an alternate to differencing as both can render a non-statianary series to stationarity. Another often useful scheme to make a series stationary is to de-trend it using one or more trends via series like 0,0,0,0,0,0,1,2,3,3,4,5..... as predictors. Identifying which of these is the best remedy is handled by examining alternative strategies.


