1

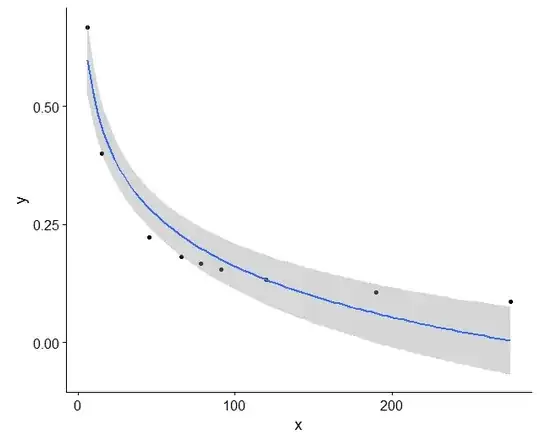
I have some data (see below) which have a very clear pattern (see graph points). However, I am struggling to fit a curve that describes the pattern really well. The closest I can get is:

y ~ log(x) 

Which gives a R^2 of 0.91 (already very high). However, I think that it should be possible to get a better fit because the fit underestimates all values after a certain point and overestimates most before that. Does anyone have any ideas?

x <- c(91,15,15,6,45,120,6,276,190,78,66)
y <- c(0.15384615,0.40000000,0.40000000,0.66666667,0.22222222,0.13333333,0.66666667,0.08695652,0.10526316,0.16666667,0.18181818)

enter image description here

unknown
  • 137
  • 1
  • 11
  • 2
    Yes, by inspection it's quite clear how to get an essentially perfect fit ... is this an exercise for a class? – Glen_b Nov 10 '17 at 14:34
  • @Glen_b absolutely not. I've just had a long day and can't see the obvious! – unknown Nov 10 '17 at 14:37
  • I've tried a polynomial, which gives a 0.97 R^2 value, but this is clearly not the right approach as the curve should look more like a log than a polynomial – unknown Nov 10 '17 at 14:42
  • 3
    It's not a log at all. How do the values arise? Up to rounding/truncation error there's an obvious numerically exact relationship based on integers. Why would $n\choose 2$ come into it? Are you counting pairs somehow? What's going on here? How does this come about? What are we doing? – Glen_b Nov 10 '17 at 14:42
  • 1
    Why the reluctance to explain what we're doing? Why so coy about this? – Glen_b Nov 10 '17 at 15:18
  • 2
    I am confident that if you were to follow the procedure detailed at https://stats.stackexchange.com/a/35717/919, you would find a near-perfect fit. – whuber Nov 10 '17 at 15:35
  • @Glen_b Fitting a curve to data from some work I did on ants. x is the number of possible connections and y is the proportion that exist. – unknown Nov 10 '17 at 17:46
  • 1
    I think one of @Glen's points might be that these data don't tell us anything about ants: they reflect a pure mathematical relationship inherent in your procedure, a relationship exactly predictable before you even looked at your first ant. – whuber Nov 10 '17 at 17:49
  • @whuber. Yes, I see. Mistake in data prep. Thanks for all the help! – unknown Nov 10 '17 at 18:10

1 Answers1

5

What I originally saw in the data (and originally wrote some hours ago) --

There are two obvious things by just looking at the numbers:

Note that $2x$ is of the form $k(k+1)$.

Note also that the $y$ values are simple fractions, with numerators of 2; you should immediately be able to spot $2/5$, $2/3$, $2/9$ and $2/15$ in there.

So look at 2/y:

  2/y
 [1] 13  5  5  3  9 15  3 23 19 12 11

Whereupon we immediately see the exact relationship:

  2*x ;   2/y * (2/y + 1)
 [1] 182  30  30  12  90 240  12 552 380 156 132
 [1] 182  30  30  12  90 240  12 552 380 156 132

It's easy to make y the subject if need be ($y= \frac{4}{\sqrt{8x+1}-1}$), but that obscures the fact that $k=2/y$ is integer and $x = k(k+1)/2$

There's no "fitting" needed, this is a mathematical relationship.


Now we can consider the update with additional information:

x is the number of possible connections

So my "why would $n\choose 2$ come into it?" is answered with "that's the number of possible connections between pairs of ants", where $n=k+1$ for the $k$ I mention above.

and y is the proportion that exist

This seems unlikely because we had $y=2/(n-1)$ every time; no variation.

Mistake in data prep.

That'd do it. Explaining the underlying problem helps. While a degree of abstraction may be a good thing, abstracting out all of the details removes valuable context with which we can often say something useful (in this case for example, whuber being able to say it wasn't telling you anything about ants).

I would not get rid of the $n$; even if you calculate $x=n(n-1)/2$ the $n$ may be the better starting point when looking for a relationship, so I'd use it once you have your actual y-variable. Once you consider how y and n relate you can connect y and x easily. If you had kept the $n$ with your data and used it to find relationships with the other variables, I'd be very surprised if you hadn't found what I figured out quite quickly (the exact algebraic relationship that shows that it's not the correct data).
Glen_b
  • 257,508
  • 32
  • 553
  • 939