6

I have a dataset with the following characteristics and I can’t seem to wrap my head around it. “Three st.dev.s include 99.7% of the data” is what I tell myself, but that seems to be inaccurately worded.

Observations: 2246
Mean: 39
St.dev.: 3
Min: 34
Max: 46
Mean - 3*sd: 30
Mean + 3*sd: 48

This tells me that 99.7% of the data lie within 30 and 48, but a 100% of the data lie within 34 and 46 and that doesn’t make sense. Does it just mean my sample is not representative of the total population? I mean, obviously, it isn't, but let's assume I don't know that humans younger than 34 and older than 46 exist. By the way, this is from the variable age from the Stata sample dataset nlsw88.dta.

I have looked at this question, but it doesn't help me untie my brain knot, either. ht place to ask.

EDIT: Just realized those are many questions. Please consider the header question the one that needs an answer. The rest is pretty much just my messed up thought process unfurling.
thymaro
  • 179
  • 1
  • 1
  • 7
  • 1
    The min and the max are the min and max of the population that you _observed_. The standard deviation is calculated from the sample population. Assuming then an infinitely large population with the same characteristics as the observed sample, and a normal distribution, 99.7% of people would be between 30 and 48. The corollary is that your initial sample would have had to be larger to have observed someone less than 34 or greater than 46. – Andy Clifton Nov 01 '17 at 15:58

3 Answers3

18

“Three st.dev.s include 99.7% of the data”

You need to add some caveats to such a statement.

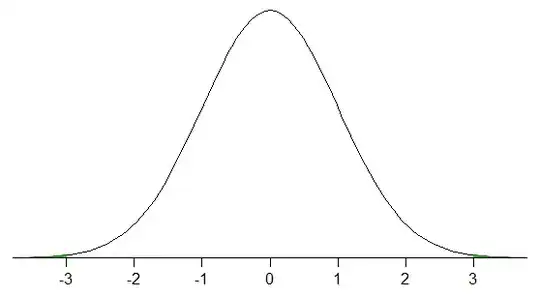
The 99.7% thing is a fact about normal distributions -- 99.7% of the population values will be within three population standard deviations of the population mean.

normal density

In large samples* from a normal distribution, it will usually be approximately the case -- about 99.7% of the data would be within three sample standard deviations of the sample mean (if you were sampling from a normal distribution, your sample should be large enough for that to be approximately true - it looks like there's about a 73% chance of getting $0.9973 \pm 0.0010$ with a sample of that size).

* assuming random sampling

But you don't have a sample from a normal distribution.

If you don't put some restrictions on the distribution shape, the actual proportion within 3 standard deviations of the mean may be high or lower.

standardized-uniform density $\qquad\qquad^\text{Example of a distribution with 100% of the distribution inside 2 sds of mean}$

The proportion of a distribution within 3 standard deviations of the mean could be as low as 88.9%. You may require more than 18 standard deviations to get 99.7% in. On the other hand you can get more than 99.7% within a good deal less than one standard deviation. So the 99.7% rule of thumb isn't necessarily much help unless you pin the distribution shape down a bit.

If you relax your expectation a bit (to be only very "roughly" 99.7%), then the rule is sometimes useful without requiring normality as long as we keep in mind that it's not always going to work in every situation - even approximately.

Glen_b
  • 257,508
  • 32
  • 553
  • 939
2

The short answer is that your sample has not precisely followed a normal distribution, so suggests perhaps you might need to re-examine your base assumptions, specifically one that you can apply tools designed for working with a normally distributed population.

Just turn your question the other way round for enlightenment. If your sample was normally distributed, then one would expect a sample size of ~2000 to yield 6 data-points outside the range 30-48, on average. Yours does not, which signals a question 'What is the significance of this deviation from normal for any predictions you make by assuming that your wider population is following a normal distribution?'

So the wider implication of this small anomaly is that, although your sample may not differ far from a normal distribution, some forecasts made assuming that it does represent a bigger normally distributed population could be inherently flawed and may warrant some qualification or further investigation. However estimating the likelihood of this deviation from normal, and the implied error margins and reliability of resulting forecasts is way beyond my level of ability, although fortunately explored in the many other answers here!

But you clearly have a good habit to scrutinise your results in full, to question what your results genuinely mean and whether they prove your original hypothesis or not. Look for further abnormalities revealed in the data, like Kurtosis and Skew to see what clues they reveal or perhaps consider other distributions as better representing your population.

0

“Three st.dev.s ($3\sqrt{\sigma^2}$) include 99.7% of the data” refers to Gaussian distributions. For distributions in general, Chebyshev's inequality puts a lower bound on the amount of probability mass withing $k$ of the mean. But is there an upper bound?

With a Bernoulli distribution with $p$ = .5, the $\sigma$ is .5 . The mean $\mu$ is also .5, which means that 100% of the distribution is within $1\sigma$ or $\mu$. What about smaller numbers of standard deviations?

Note: the following, for simplicity is an argument regarding distributions with $\mu = 0$. Its extension to distribution with arbitrary $\mu$ is reasonably trivial.

Given any positive $\varepsilon$ and $M$, there is a distribution such that you have $\varepsilon/2$ probability mass $\leftarrow M$ and $\varepsilon/2$ probability mass $\gt M$. That is,

$p(\lvert{x}\rvert \gt M) = \varepsilon$

All else being equal, as $M \to \infty$, then $\sigma \to \infty$. However, for any fixed positive $N$, once $M$ exceeds $N$, the probability mass within $N$ of zero is always $1-\varepsilon$, regardless of $M$. Thus, if we look at the relative distance from zero (that is, the number of standard deviations the value is $= \frac{\lvert{x}\rvert}{\sigma}$), then as $M \to \infty$, we have $n \to \infty$, where $n$ is the largest integer such that "$1-\varepsilon$ of the probability is within $n\sigma$ of $\mu$" is true.

This shows that for any positive numbers $\varepsilon$ and $n$, there is some distribution such that the probability of being more than $n\sigma$ from zero is less than $\varepsilon$. So, for instance, if you want a probability of 99.999% of being less than .000001 $\sigma$ from zero, there is a distribution that satisfies that.

thymaro
  • 179
  • 1
  • 1
  • 7
Acccumulation
  • 3,688
  • 5
  • 11