24

I have mean 74.10 and standard deviation 33.44 for a sample that has minimum 0 and maximum 94.33.

My professor asks me how can mean plus one standard deviation exceed the maximum.

I showed her many examples about this, but she doesn't understand. I need some reference to show her. It could be any chapter or paragraph from a statistics book that talks particularly about this.

Glen_b
  • 257,508
  • 32
  • 553
  • 939
Boyun Omuru
  • 241
  • 1
  • 2
  • 3
  • Why do you want to add (or subtract) one standard deviation from the mean? The SD is a measure of the spread of the data. Did you want the standard error of the mean instead perhaps? – Gavin Simpson Nov 17 '14 at 22:38
  • I don't want to add or subtract, the one that wants this is my professor. That is the way she understands the standart deviation – Boyun Omuru Nov 17 '14 at 23:22
  • 5
    An interesting example is the sample (0.01,0.02,0.98,0.99). Both the mean plus the standard deviation and the mean minus the standard deviation lie outside [0,1]. – Glen_b Nov 18 '14 at 09:59
  • Maybe she's just thinking of a Normal distribution? – user765195 Nov 27 '14 at 07:00

6 Answers6

31

Certainly the mean plus one sd can exceed the largest observation.

Consider the sample 1, 5, 5, 5 -

it has mean 4 and standard deviation 2, so the mean + sd is 6, one more than the sample maximum. Here's the calculation in R:

> x=c(1,5,5,5)
> mean(x)+sd(x)
[1] 6

It's a common occurrence. It tends to happen when there's a bunch of high values and a tail off to the left (i.e. when there's strong left skewness and a peak near the maximum).

--

The same possibility applies to probability distributions, not just samples - the population mean plus the population sd can easily exceed the maximum possible value.

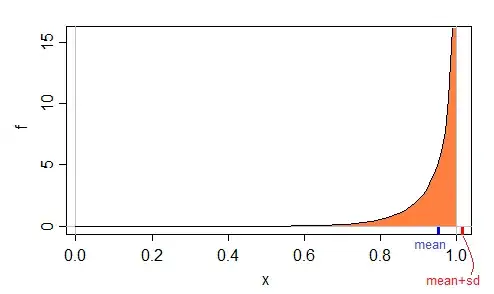
Here's an example of a $\text{beta}(10,\frac{1}{2})$ density, which has a maximum possible value of 1:

enter image description here

In this case, we can look at the Wikipedia page for the beta distribution, which states that the mean is:

$\operatorname{E}[X] = \frac{\alpha}{\alpha+\beta}\!$

and the variance is:

$\operatorname{var}[X] = \frac{\alpha\beta}{(\alpha+\beta)^2(\alpha+\beta+1)}\!$

(Though we needn't rely on Wikipedia, since they're pretty easy to derive.)

So for $\alpha=10$ and $\beta=\frac{1}{2}$ we have mean$\approx 0.9523$ and sd$\approx 0.0628$, so mean+sd$\approx 1.0152$, more than the possible maximum of 1.

That is, it's easily possible to have a value of mean+sd large enough that it cannot be observed as a data value.

--

For any situation where the mode was at the maximum, the Pearson mode skewness need only be $<\,-1$ for mean+sd to exceed the maximum, an easily satisfied condition.

--

A closely related issue is often seen with confidence intervals for a binomial proportion, where a commonly used interval, the normal approximation interval can produce limits outside $[0,1]$.

For example, consider a 95.4% normal approximation interval for the population proportion of successes in Bernoulli trials (outcomes are 1 or 0 representing success and failure events respectively), where 3 of 4 observations are "$1$" and one observation is "$0$".

Then the upper limit for the interval is $\hat p + 2 \times \sqrt{\frac{1}{4}\hat p \left(1 - \hat p \right)} = \hat p + \sqrt{\hat p (1 - \hat p )} = 0.75 + 0.433=1.183$

This is just the sample mean + the usual estimate of the sd for the binomial ... and produces an impossible value.

The usual sample sd for 0,1,1,1 is 0.5 rather than 0.433 (they differ because the binomial ML estimate of the standard deviation $\hat p(1-\hat p)$ corresponds to dividing the variance by $n$ rather than $n-1$). But it makes no difference - in either case, mean + sd exceeds the largest possible proportion.

This fact - that a normal approximation interval for the binomial can produce "impossible values" is often noted in books and papers. However, you're not dealing with binomial data. Nevertheless the problem - that mean + some number of standard deviations is not a possible value - is analogous.

--

In your case, the unusual "0" value in your sample is making the sd large more than it pulls the mean down, which is why the mean+sd is high.

enter image description here

--

(The question would instead be - by what reasoning would it be impossible? -- because without knowing why anyone would think there's a problem at all, what do we address?)

Logically of course, one demonstrates it's possible by giving an example where it happens. You've done that already. In the absence of a stated reason why it should be otherwise, what are you to do?

If an example isn't sufficient, what proof would be acceptable?

There's really no point simply pointing to a statement in a book, since any book may make a statement in error - I see them all the time. One must rely on direct demonstration that it's possible, either a proof in algebra (one could be constructed from the beta example above for example*) or by numerical example (which you have already given), which anyone can examine the truth of for themselves.

* whuber gives the precise conditions for the beta case in comments.

Glen_b
  • 257,508
  • 32
  • 553
  • 939
  • 5
    +1 The Beta example is a nice idea. In fact, provided $0\lt\beta\lt 1$ and $\alpha \gt \beta(1+\beta)/(1-\beta)$, *any* Beta$(\alpha,\beta)$ distribution will have mean+sd exceeding $1$. – whuber Nov 17 '14 at 23:11
  • Let me explain further. I am looking for accuracy percentage of particular appliance used for correction of teeth. And this appliance performed accuracy percentage for 7 tooth as follow: %76,19, %77,41, %94,33, %91,06, %0, %87,77, %91,96. My professor adds one standart deviation to mean and states that the result can not exceed maximum value even %100 because %100 is the maximum accuracy percentage that appliancek can perform. – Boyun Omuru Nov 17 '14 at 23:32
  • What's an "accuracy percentage"? I don't know what that term means. Why is your professor adding a standard deviation to the mean? Why should that mean anything at all? Her mistake is in thinking that adding a standard deviation to the mean should necessarily yield a value that is possible for a percentage. Why would it? – Glen_b Nov 17 '14 at 23:36
  • Note that your numerical example fits my description - you have a bunch of high values, and a tail off to the left (suggested by the low value of 0). That's exactly when this can happen. There's really no good reason to expect adding any number of standard deviations (even a fraction of one) to the mean should respect the 100% boundary. – Glen_b Nov 17 '14 at 23:41
  • Firstly let me explain "accuracy percentage". For example you want to achieve 1 mm movement of tooth. By using an appliance you achieve only 0,40 mm movement. The accuracy percentage for this example is %40 – Boyun Omuru Nov 17 '14 at 23:41
  • Boyun -- Thanks for that. Why is the professor adding a standard deviation to the mean? – Glen_b Nov 17 '14 at 23:42
  • And why does she wants to add one standart deviation to mean I don't understand... – Boyun Omuru Nov 17 '14 at 23:42
  • That is the way she thinks about standart deviation unfortunately and I can not change her mind – Boyun Omuru Nov 17 '14 at 23:43
  • How would you compute the accuracy percentage if the achieved movement was 1,20 mm ? – Glen_b Nov 17 '14 at 23:45
  • In my study planned movement never exceeds achieved movement – Boyun Omuru Nov 17 '14 at 23:48
  • All I want is to show her a reference. I don't want to spell the words that she deserve but without making her understand this I can not move further... – Boyun Omuru Nov 17 '14 at 23:54
  • 2
    She's right that a percentage > 100% makes no sense in your situation. The problem is actually the unstated premise that adding one sd to the mean should make sense in this context, when it *doesn't*. That's where I believe your difficulty originates. If we understood where the premise came from, it might lead to a better resolution. It's possible that the simple fact is stated in a book somewhere (it's a trivial observation, though, so it's possible it isn't, either), but I doubt it will ever be put in a way that will satisfy her, because her false premise is the source of the problem. – Glen_b Nov 18 '14 at 00:06
  • Thank you again for your contribution. Everything is clear for me. Now a new trial begins for me - to make her understand. I will show her your comments. Thanks a lot – Boyun Omuru Nov 18 '14 at 08:02
  • I'd be happy to discuss in chat to clear anything up. – Glen_b Nov 18 '14 at 08:59
  • Pedantically, you and R are using the $n-1$ sample standard deviation calculation. If the population is $1,5,5,5$ then its standard deviation is $\sqrt{3} \gt 1$ so your example is still valid. – Henry Nov 18 '14 at 09:52
  • @Henry I was deliberately using the usual sample standard deviation there; the OP's problem involves sample mean and standard deviation. But yes, the $n$-divisor version also has the same issue. – Glen_b Nov 18 '14 at 09:54
  • 1
    Indeed - my minor point is that this curiosity is a result of what standard deviations represent for strongly non-symmetric distributions rather than a result of taking a sample. But in general, I think your answer is excellent – Henry Nov 18 '14 at 10:00
  • @Glen_b I think she wants to add and substract one SD to mean because of her vague sense of Chebychev's inequality. From what I read I don't think she knows about it in particular actually. Instead she thinks about the special case of a normal distribution for which the OP's observation would not be possible. Having said that she also does not know enough about statistics to supervise this student's project. – tomka Nov 06 '16 at 12:34
  • 4
    @tomka I have attempted to help many students in a similar position. I eventually learned the (possibly unsurprising) rule of thumb that it's effectively impossible to teach a supervisor anything through the medium of their student. – Glen_b Nov 06 '16 at 22:59
5

Per Chebyshev's inequality, less than k -2 points can be more than k standard deviations away. So, for k=1 that means less than 100% of your samples can be more than one standard deviation away.

It's more interesting to look at the low bound. Your professor should be more surprised there are points which are about 2.5 standard deviations below mean. But we now know that only about 1/6th of your samples can be 0.

MSalters
  • 261
  • 2
  • 8
4

In general for the Bernoulli random variable $X$, that takes the value $1$ with probability $0<p<1$ and the value $0$ with probability $1-p$, we have

$$E(X) = p,\;\; SE(X) = \sqrt {p(1-p)}$$

And we want

$$E(X)+ SE(X) > 1 \Rightarrow p +\sqrt {p(1-p)} >1$$

$$\Rightarrow \sqrt {p(1-p)} > (1-p)$$

Square both sides to obtain

$$p(1-p) > (1-p)^2 \Rightarrow p > 1-p \Rightarrow p > \frac 12$$

In words, for any Bernoulli random variable with $p>1/2$ the theoretical expression $E(X)+ SE(X) > \max X$ holds.

So for example, for any i.i.d. sample drawn from a Bernoulli with, say, $p=0.7$, in most cases the sample mean plus the sample standard deviation will exceed the value $1$, which will be the maximum value observed (bar the case of an all-zeros sample!).

For other distributions we always have the opposite direction in the inequality, e.g. for a Uniform $U(a,b)$, it is always the case that $E(U)+ SE(U) < \max U=b$.
Therefore, no general rule exists.

Alecos Papadopoulos
  • 52,923
  • 5
  • 131
  • 241
4

The essence of the problem may be that your distribution is not a normal distribution which a standard deviation assumes. Your distribution is likely left skewed, so you need to transform your set into a normal distribution first by picking a suitable transform function, this process is called transformation to normality. One such function candidate in your case might be a mirrored log transform. Once your set satisfies a normality test you may then take the standard deviation. Then to use your 1$\sigma$ or 2$\sigma$ values you must transform them back into your original data space using the inverse of your transform function. I'm thinking this is what your professor was hinting at.

Snives
  • 476
  • 5
  • 5
  • 6
    This is a nice contribution. I'm not sure that the SD really "assumes" a normal distribution, though. – gung - Reinstate Monica Mar 25 '15 at 18:08
  • 3
    "Distribution fitting" and finding a transformation to normality are distinct procedures with different aims. – whuber Mar 25 '15 at 18:45
  • 1
    The standard deviation is perfectly natural as a summary for many non-normal distributions, such as the Poisson or binomial, if only because the variance is. – Nick Cox Dec 14 '21 at 09:47
1

It is quite common that people (including your professor) make this mistake.

People often do calculations assuming that one has a large sample of an ideal normal distribution. At a certain moment they start thinking that alle and everything in life shows a normal distribution. That is not true!

Especially when a distribution is not symmetric one then gets unexpected results.

People also tend to forget that in small populations (/small colletions of numbers) never have a normal distribution. It only starts to come close to a normal distribution if both the number of samples is high, and if indeed the underlaying phenomena cause the distribution to be pure and normal.

Rnus
  • 11
  • 1
0

I would like to emphasise with this answer why I think people think of the normal distribution when the subject of standard deviation comes up, like other people have already mentioned in other answers for this question. For a lot of people, indeed the first thing that comes to mind when they think of standard deviation is the figure below (or one variant of it):

enter image description here

The two sections in dark below are, as you can see in the x-axis legend, one standard deviation to the right or to the left of the mean, which is zero here. When someone else mentions that one standard deviation from the mean can be outside the range of of values of this distribution mean(X)+sd(X) > max(X) (in R code), naturally they freeze. How come!?

Maybe your professor went to R and did something like:

set.seed(2021)
N <- 10000
X <- rnorm(n=N, mean=74.10, sd=33.44)
mean(X)+sd(X) > max(X)

This returns false, but if you check, the max/min values do not match yours. What I did was to generate a normal distribution, as one can see in the plot below.

library(ggplot2)
ggplot() + 
  aes(X) +
  geom_histogram(binwidth=1)

enter image description here

Many people are introduced to the concepts of normal distributions, or standard deviations, with a figure like the first one.

You can easily generate some distributions that will have the mean+sd outside the range of values in a distribution, as many other colleagues have answered in this post, to at least prove it is possible.

As you've probably already heard, looking at a scatter plot or histogram of your data usually helps a lot. If your professor had had a look at the histogram of your data, I think s/he would be at least a bit more inclined to accept the idea :-)

mribeirodantas
  • 796
  • 3
  • 17
  • 1
    Could you explain how this answers the question? Your only germane remark appears at the end, but adds nothing to existing answers in this thread. – whuber Dec 14 '21 at 18:17
  • My intention was to emphasise why many people think of the normal distribution when standard deviation is mentioned, and how the author of the question could explain to the professor with some R code and image. I don't honestly think it adds a lot, but I still think there is some complement to what has been said. If you think it's better to delete the answer, please let me know. – mribeirodantas Dec 14 '21 at 18:32
  • 1
    I hate to see good work deleted and would instead suggest stating explicitly--perhaps at the beginning of your post--what it is intended to accomplish and how it is related to the question. – whuber Dec 14 '21 at 18:45
  • Done, @whuber. What do you think? – mribeirodantas Dec 14 '21 at 18:57
  • 1
    There's still a bit of a disconnect. The reference to normal distributions comes out of the blue: I don't see any reference to it in the question. Three *answers* do address this issue, so perhaps you might want to acknowledge them and state what you are adding to what they have already said. – whuber Dec 14 '21 at 19:57
  • I added a reference, mentioning previous answers :-) – mribeirodantas Dec 14 '21 at 20:10