8

I have air temperature measurements from two fixed locations measured at hourly intervals. The code below is a random set of numbers used to represent the format of my data:

set.seed(1)
RandData <- rnorm(8760*2,sd=10)
Locations <- rep(c('UK','France'),each=8760)

Date = seq(from=as.POSIXct("1991-01-01 00:00"), 
              to=as.POSIXct("1991-12-31 23:00"), length=8760)

Final <- data.frame(Loc = Locations,
                    Doy = as.numeric(format(Date,format = "%j")),
                    Tod = as.numeric(format(Date,format = "%H")),
                    Temp = RandData)

I can plot the variation in temperature as a funtion of day of year with the following code:

require(lattice)
xyplot(Temp~Doy | Loc, data = Final, col = "black", type = "l")

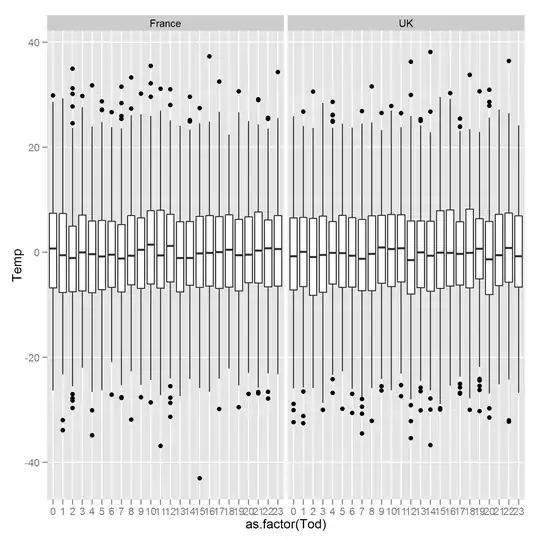
This would show the annual pattern of the data. However, what I would like to do is to produce boxplots of the variation in temperature for different times of the day. So, for the example above I would like two figures, one for each country and each figure should be composed of box plots showing the variation in temperature at 00:00, 01:00... and so on, referring to Final$Tod. How can this be achieved?

Many thanks for your help.
KatyB
  • 909
  • 2
  • 12
  • 17

2 Answers2

8

Something like this?

library(ggplot2)
ggplot(Final, aes(x = as.factor(Tod), y = Temp)) + geom_boxplot()  + facet_wrap(~ Loc)

enter image description here

Roman Luštrik
  • 3,338
  • 3
  • 31
  • 39
3
library(robustbase)
adjbox(Final$Temp[Final$Loc=="UK"]~Final$Tod[Final$Loc=="UK"])

Boxplots are a visualization tool, so i'll give you a visual advice. What you have is essentially functional data so you want (for visualization reasons) to use a box-plot tool that acknowledges that. Try the functional boxplot function in the fda package.

user603
  • 21,225
  • 3
  • 71
  • 135
  • 1
    Yes (+1), this is much easier to visualize than the many box plots as well. I will have to re-read to make sure, but I believe Tukey (in EDA) actually suggests to not use the box's like this anyway, but to connect the lines for the summary statistics (see [this similar question](http://stats.stackexchange.com/a/18826/1036)). Of course using functional boxplots is a better replacement for identifying outliers as well. – Andy W Jun 22 '12 at 12:05