2

I am using R to examine the relationship between two variables in a small data set ($n=16$).

My problem is that I'm not really sure how to handle the analysis (read: I'm in deeper waters than I've traveled before).

Do I use Spearman's Rho to calculate the rank coefficient? Or do I assume normality and use standard parametric tests (Pearson's)? Or do I transform the data, and then do the parametric tests? Or should I do something else?

My initial feeling is that I should use non-parametric tests on this data set for various reasons:

  1. I feel strongly that there is an upper and lower bound to the possible values observed for either the dependent or independent variable.
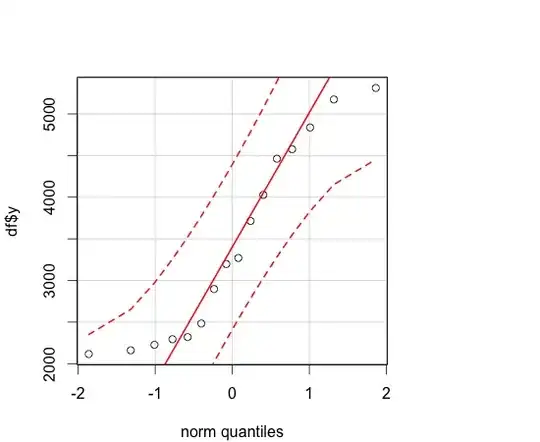
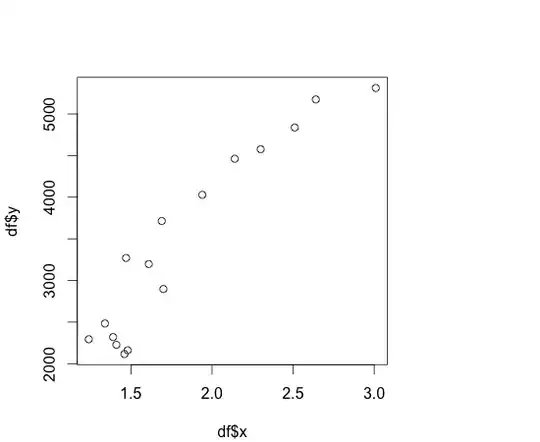
  2. I do not feel that the relationship between the variables is linear. I've provided the QQ Plot of the dependent variable, and the scatterplot of the dep & indep vars below, and neither seems to adhere to the normality assumptions:

The thing is, I'm getting hung up on several things:

  1. the Pearson's coefficient seems really high 0.94366 which makes me wonder if I'm sacrificing something by using Spearman's instead (for the sake of full disclosure, the Spearman's coefficient of 0.86765 is also significant at $\alpha = .001$). Now Answered
  2. If Spearman's is the answer, what is the next step in building a predictive model? Now Answered
  3. Since the sample is relatively small, should I use some kind of resampling to calculate the correlation instead of just using the 16 values?
  4. What other major things might I be overlooking?

Plots

QQ Plot of Indep Var: enter image description here http://dl.dropbox.com/u/27272488/qqPlotY.png

Scatterplot of Dep & Indep Vars: enter image description here http://dl.dropbox.com/u/27272488/XvsY.png


Data

> df$year
[1] 1994 1995 1996 1997 1998 1999 2000 2001 2002 2003 2004 2005 2006 2007 2008 2009
> df$x
[1] 1.39 1.41 1.48 1.46 1.24 1.34 1.70 1.61 1.47 1.69 1.94 2.30 2.51 2.64 3.01 2.14
> df$y
[1] 2320 2227 2161 2116 2294 2483 2897 3197 3270 3714 4028 4576 4837 5174 5312 4462
Andy
  • 18,070
  • 20
  • 77
  • 100
Chris O
  • 21
  • 4
  • (1) You implicitly assume correlation is the way to "examine the relationship." Why is it of interest here? (There are many alternatives.) (2) What limits do you think apply to these variables? (3) What can you tell us about sources of variation or error that may affect the apparent relationship among the variables? (4) This appears to be a time series. Is there a reason to be ignoring time? (5) Note that linearity and normality are separate things. Are you interested in normality for its own sake or because you are concerned about how it could affect interpretation of correlations? – whuber May 31 '12 at 19:47
  • 1. I wanted to look at correlation because I think there's a predictive relationship between x and y. 2. X is basically a price index. Y is deaths. The index may have a high upper bound, but will not ever be lower than 0 (and likely will not ever be lower than 1). Deaths will not ever be lower than 0 (and likely not ever lower than some much higher number, perhaps 2000), and will not exceed some as-yet-determined maximum (the pool of people is limited, and has multiple causes of death). – Chris O May 31 '12 at 20:12
  • 3. There are definitely other influences on Y besides X, but I believe that much of the fluctuation is due to X, and I do not have the means to measure the other factors. 4. Time itself is not an inherent influence on either of these. 5. I am concerned insofar as it effects the interpretation of the correlations. – Chris O May 31 '12 at 20:12
  • re: #3, perhaps what I'm trying to say is that I think that that X accounts for most of the 'noise' in Y. – Chris O May 31 '12 at 20:19
  • +1 That information greatly improves the question, Chris. There are some principles that suggest looking at the model `lm(sqrt(y) ~ log(x))`. It is *slightly* better than using the raw data but has better theoretical justification. But you almost have to look at this as a time series, if only because the date is still a strongly significant factor (using raw or transformed data). – whuber May 31 '12 at 21:13
  • @whuber: Thanks! Can you point me to some reading where I could brush up on the theory? Also (and please forgive the ignorance that may lie in this question) how would I treat this as a time series and still retain the X vs Y focus? – Chris O May 31 '12 at 21:30
  • (1) You will find lots of reading here with a search for [+transformation +regression](http://stats.stackexchange.com/search?q=%2Btransformation+%2Bregression&submit=search). (2) Start with `fit – whuber May 31 '12 at 21:34
  • @whuber: Thank you so much for the help and the direction on further reading... stack.lm – Chris O Jun 01 '12 at 00:31
  • Regarding your third question: why do you suggest using resampling for _computing_ the correlation? It would make more sense to use a resampling approach for _testing_ whether the correlation is 0 (which it clearly isn't). – MånsT Jun 01 '12 at 12:53
  • 2
    Since this is time cross-correlations are impacted by auto-correlative structure within the two series . See http://stats.stackexchange.com/questions/27748/relationship-between-two-time-series-arima/27756#27756 – IrishStat Jun 01 '12 at 13:41
  • @MånsT: My phrasing is probably not as accurate as it should be. Are you saying that you see no benefit to resampling (or cross validation) in this case? – Chris O Jun 01 '12 at 17:20
  • @IrishStat : Thanks for the link. I'm off to check it out... – Chris O Jun 01 '12 at 17:24
  • @IrishStat : Okay, I'm not ashamed to admit that I'm lost... I'm not really sure how to tease out which parts of your link are applicable to this scenario, and which ones are not. I can't even seem to recreate the first residuals plot in your linked answer (i.e. after running through Matt Albrecht's code, and plotting lm0, lm1 and lm2). I don't want to waste your (or anyone else's) time, but I'm unsure where to go from here. – Chris O Jun 01 '12 at 18:07

0 Answers0