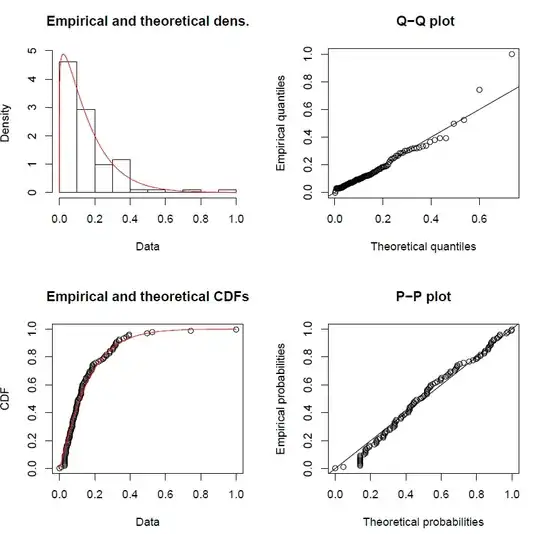
I tried to fit my data to the Weibull and I got the following output:
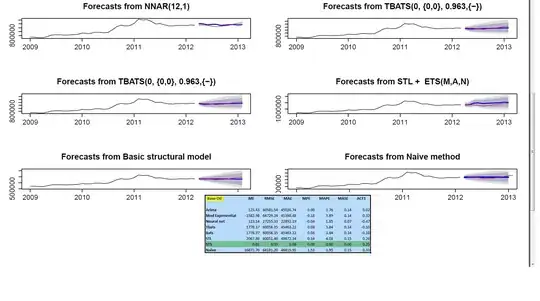
I then used R to generate 10,000 bootstrapped parameters of fit values for a and I got this output (image2):
Does this mean the distribution of my data fit well with a weibull distribution of the shape and size, approximated by bootstrapping?
library(ggplot2)
library(ggpmisc)
library(RColorBrewer)
library(Cairo)
library(grid)
library(moments)
library(fitdistrplus)
library(logspline)
library(adSim)
library(MASS)
library(car)
library(plot3D)

df <- read.csv("c:/master.csv", header=T, sep=",")
df[!(rowSums(is.na(df))),]
attach(df)
mp <- subset(df)
#mp <- subset(df, mars == "x")
grades <- mp$SCBO
gradena <- na.omit(grades)

data <- as.numeric(gradena)

range01 <- function(x){ (x - min(x))/(max(x)-min(x)) * (0.99999999 -
0.00000001) + 0.00000001 }
data2 <- range01(data)
ft <- fitdist(data2, "weibull")

plot(ft)
gofstat(ft)


b.ft <- bootdist(ft,niter=10001)
summary(b.ft)
plot(b.ft, col = ramp.col(col = c("darkred","blue","green"),
n = 10001, alpha = 0.4))

